For
virtually every performance tuning and tweaking task you're likely to
accomplish, the tools built into Windows are more than adequate. That's
especially true with the vastly improved Resource Monitor in Windows 7.
But if you crave more information, we can recommend two specialized
tools:
Performance Monitor (Perfmon.exe)
should be familiar to grizzled Windows veterans, having been around
since well before the turn of the millennium. The underlying code is
still in Windows, powering both Resource Monitor and the System Health
report. Its old-style
interface still offers some capabilities that can't easily be achieved
any other way. It allows you to track a much longer list of performance
metrics than is available in either of its simpler cousins, Task Manager
and Resource Monitor. You can also use it to log performance data to
disk files or export to programs such as Microsoft Office Excel for
detailed analysis.
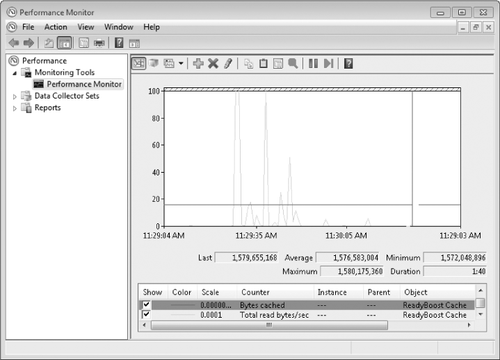
The fastest way to open Performance Monitor is the direct route: type perfmon at a command prompt. The Performance Monitor console, shown in Figure 1,
provides several views of performance, including a System Summary and
the graphical display shown here, which we've customized to track the
performance of the ReadyBoost cache. Full coverage of this complex
utility is beyond the scope of this book. For more details about its
operation, see Windows 7 Resource Kit, by Mitch Tulloch, Tony Northrup, and Jerry Honeycutt (Microsoft Press, 2009).
Process Explorer
is another old-timer, originally developed by Mark Russinovich as a
third-party utility for Winternals, the software company he and partner
Bryce Cogswell founded in 1996. When Microsoft bought Winternals and its
Sysinternals software library in 2006, some feared that development
would stop cold. Thankfully, that fear turned out to be misplaced.
Cogswell and Russinovich are now Microsoft employees; the Sysinternals
website is still alive and well (although the sysinternals.com
URL now redirects to a page at Microsoft's TechNet); and its flagship
program, Process Explorer, is updated regularly and is fully compatible
with Windows 7. To download Process Explorer, visit w7io.com/2005.
Process Explorer
combines the best of Task Manager and Resource View in a single highly
customizable display. Its two-pane display, shown in Figure 2,
provides system information, a hierarchical view of all running
processes (including services), and an overwhelming number of technical
details about how each process uses CPU and memory. It all runs in real
time, making it an ideal troubleshooting tool. For serious performance
tuning and troubleshooting, it has no peer.

When you right-click any
entry in the Process list, you get a dialog box with an amazing amount
of information about the process. You can kill, suspend, or restart a
process any time. Double-click any process to see what that process is
really up to.
The thing we love most
about Process Explorer is its no-hassle installation and operation. The
standalone executable requires no installation, only the acceptance of a
license agreement. Copy the program to a convenient location and
double-click to run it. When you close the program, it leaves no traces
in memory and only a single registry key to store your preferences.
