The Line element looks simple but the markup is a little bloated. You can actually reduce the markup for drawing a single line by switching from the Line to the Polyline:
<Grid Background="LightCyan">
    <Polyline Points="100 300 200 50"
              Stroke="Blue"
              StrokeThickness="5" />
    <Polyline Points="50 100 300 200"
              Stroke="Red"
              StrokeThickness="30" />
</Grid>

The Points property of the Polyline class is of type PointCollection, a collection of Point objects. In XAML you indicate multiple points by just alternating the X and Y
coordinates. You can string out the numbers with spaces between them as
I’ve done, or you can clarify the markup a little with commas. Some
people prefer commas between the X and Y coordinates:
<Polyline Points="100,300 200,50" ...
Others (including me) prefer to separate the individual points with commas:
<Polyline Points="100 300, 200 50"
The advantage of Polyline is that you can have as many points as you want:
<Grid Background="LightCyan">
    <Polyline Points="100 300, 200  50,
                      350 100, 200 250"
              Stroke="Blue"
              StrokeThickness="5" />

    <Polyline Points=" 50 100, 300 200,
                      300 400"
              Stroke="Red"
              StrokeThickness="30" />
</Grid>

Each additional point increases the total polyline by another line segment.
The Polyline does have one significant disadvantage that Line doesn’t have: Because you’re now dealing with a collection of Point
objects, the individual points can’t be targets of a style, or a data
binding, or an animation. This is not to say that you can’t change the PointCollection at runtime and have that change reflected in the rendered Polyline.
Although the Polyline
can draw some simple connected lines, it tends to feel underutilized if
it’s not fulfilling its true destiny of drawing complex curves, usually generated algorithmically in code. The Polyline
is always a collection of straight lines, but if you make those lines
short enough and numerous enough, the result will be indistinguishable
from a curve.
For example, let’s suppose you want to use Polyline to draw a circle. Commonly, a circle centered at the point (0, 0) with a radius R is defined as all points (x, y) that satisfy the equation:

This is also, of course, the Pythagorean Formula.
But when generating points to draw a graphical circle, this formula tends to be a little clumsy: You need to pick values of x between –R and R, and then solve for y (keeping in mind that most values of x correspond to two values of y) and even if you do this in a systematic manner, you’re going to get a higher density of points in the region where x is close to 0 than the region where y is close to 0.
A much better approach for computer graphics involves parametric equations, where both x and y
are functions of a third variable, sometimes called t to suggest time.
In this case that third variable is simply an angle ranging from 0 to
360°.
Suppose the circle is centered on the point (0, 0) and has a radius of R. The circle will be enclosed within a box where values of x go from –R on the left to +R on the right. In keeping with the Silverlight convention that increasing values of y go down, values of y range from –R on the top to +R on the bottom.
Let’s begin with an angle of 0° at the rightmost edge of the circle, which is the point (R, 0), and let’s go clockwise around the circle. As the angle goes from 0° to 90°, x goes from R to 0, and then x goes to –R at 180° and then goes back down to zero at 270° and back to R at 360°. This is a familiar pattern:

At the same time, the values of y go from 0 to R to 0 to –R and back to 0, or

Depending where the
circle begins, and in what direction you go, you could have slightly
different formulas where the sine and cosine functions are switched, or
one or both or negative.
If you use different values of R for the two formulas, you’ll draw an ellipse. If you want the circle centered at the point (Cx, Cy), you can add these values to the previous results:
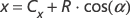
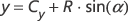
In a program, you put those two formulas in a for loop that increments an angle value ranging from 0 to 360 to generate a collection of points.
How much granularity
is required to make the resultant circle look smooth? In this particular
example, it depends on the radius. The circumference of a circle is 2πR,
so if the radius is 240 pixels (for example), the circumference is
approximately 1,500 pixels. Divide by 360° and you get about 4, which
means that if you increment the angle in the for
loop by 0.25°, the resultant points will be about a pixel apart.
Let’s create a new projecvt. Bring up the MainPage.cs file and install a handler for the Loaded event to allow accessing the dimensions of the ContentPanel grid. Here are calculations for center and radius for a circle to occupy the center of a content panel and reach to its edges:
Point center = new Point(ContentPanel.ActualWidth / 2,
                         ContentPanel.ActualHeight / 2 - 1);
double radius = Math.Min(center.X - 1, center.Y - 1);
Notice the pixel subtracted from the calculation of the radius. This is to prevent the circle from being geometrically the same as the content area size. The stroke thickness straddles the geometric line so it would otherwise get cropped off at the edges.
Now create a Polyline and set the Stroke and StrokeThickness properties:
Polyline polyline = new Polyline();
polyline.Stroke = this.Resources["PhoneForegroundBrush"] as Brush;
polyline.StrokeThickness = (double)this.Resources["PhoneStrokeThickness"];
Calculate the Point objects in a for loop based on the formulas I’ve just showed you and add them to the Points collection of the polyline:
for (double angle = 0; angle < 360; angle += 0.25)
{
    double radians = Math.PI * angle / 180;
    double x = center.X + radius * Math.Cos(radians);
    double y = center.Y + radius * Math.Sin(radians);
    polyline.Points.Add(new Point(x, y));
}
Now add the Polyline to the Grid:
ContentPanel.Children.Add(polyline);
And here’s the result:

So big deal. We created a circle a hard way rather than an easy way. And it’s not even a complete circle: Because the angle in the for loop didn’t go all the way to 360, there’s actually a little gap at the right side.
But instead of fixing that problem, let’s do something a little different. Let’s make the angle go all the way to 3600:
for (double angle = 0; angle < 3600; angle += 0.25)
Now the loop will go around the circle 10 times. Let’s use that angle and the original radius value to calculate a scaledRadius:
double scaledRadius = radius * angle / 3600;
And use that scaledRadius value for multiplying by the sine and cosine values. Now the result is an Archimedian spiral:

Here’s the complete class:
Example 1. Silverlight Project: Spiral File: MainPage.xaml.cs (excerpt)
public partial class MainPage : PhoneApplicationPage
{
    public MainPage()
    {
        InitializeComponent();
        Loaded += OnLoaded;
    }

    void OnLoaded(object sender, RoutedEventArgs args)
    {
        Point center = new Point(ContentPanel.ActualWidth / 2,
                                 ContentPanel.ActualHeight / 2 - 1);
        double radius = Math.Min(center.X - 1, center.Y - 1);

        Polyline polyline = new Polyline();
        polyline.Stroke = this.Resources["PhoneForegroundBrush"] as Brush;
        polyline.StrokeThickness = (double)this.Resources["PhoneStrokeThickness"];

        for (double angle = 0; angle < 3600; angle += 0.25)
        {
             double scaledRadius = radius * angle / 3600;
             double radians = Math.PI * angle / 180;
             double x = center.X + scaledRadius * Math.Cos(radians);
             double y = center.Y + scaledRadius * Math.Sin(radians);
             polyline.Points.Add(new Point(x, y));
        }
        ContentPanel.Children.Add(polyline);
    }
}
|
It’s not necessary to create the Polyline object in code: You could define it in XAML and then just access it to put the points in the Points collection.
