2. Monitoring the Processors
The main processors of a server do the majority of
the hard work, executing the operating system code and all applications.
This is the next logical place to start looking at the performance of a
system. With SQL Server 2008, you can identify the number of CPUs you
want to utilize on your physical machine. If your physical machine has
32 CPUs, you might not necessarily want to make all 32 CPUs available to
SQL Server. In fact, in some cases, this would be a detriment; some CPU
processing should be reserved for the OS and the network management on
heavily loaded servers (5% of the CPUs). SQL Server allows you to
identify how many CPUs it can use from what is available on the physical
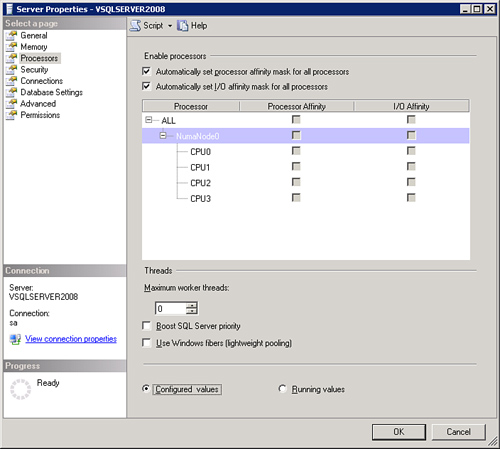
machine. In Figure 1,
you can see the number of CPUs available to SQL Server on a typical
server from the SSMS Server Properties page. In this example, all CPUs
are being made available to SQL Server.
In a 32-CPU server example and using the 5% number
just mentioned, you should let SQL Server use 30 of the CPUs and reserve
2 CPUs for dedicated network- and OS-related activity (0.05 × 32 = 1.6,
rounded up to 2 CPUs). This also allows SQL Server to utilize SQL
parallelism effectively.
Keep in mind that from a
multitasking point of view, Windows servers often move process threads
among different processors. This process thread movement activity can
reduce Microsoft SQL Server performance under heavy system loads because
each processor cache is repeatedly reloaded with data. It is possible
to assign processors to specific threads, which can improve performance
under these types of conditions by eliminating processor reloads. This
association between a thread and processor is called processor affinity.
SQL Server 2008 supports processor affinity by means of two affinity
mask options: affinity mask (also known as CPU affinity mask) and
affinity I/O mask. If you do nothing, SQL Server is allowed to use each
CPU for all its processing, with no affinity whatsoever. The operating
system distributes threads from instances of SQL Server evenly among
these CPUs.
The affinity I/O mask option binds SQL Server disk
I/O to a specified subset of CPUs. In high-end SQL Server online
transaction processing (OLTP) environments, this extension can enhance
the performance of SQL Server threads issuing a high number of I/Os.
This enhancement does not support hardware affinity for individual disks
or disk controllers, though. Perhaps this will be a future enhancement
to SQL Server.
Note
A side effect of specifying the affinity mask option is that the operating system does not
move threads from one CPU to another. Most systems obtain optimal
performance by letting the operating system schedule the threads among
the available CPUs, but there are exceptions to this approach. The only
time we have used this affinity setting was to isolate CPUs to specific
SQL Server instances on the same box that had numerous CPUs to utilize.
Typically, you should leave the settings to have SQL Server
automatically set processor and I/O affinity as needed unless your
processor monitoring indicates manually configuring the affinity may be
necessary.
Monitoring Processors in Performance Monitor
From a Performance Monitor point of view, the
emphasis is on seeing if the processors that are allocated to the server
are busy enough to maximize performance but not so saturated as to
create a bottleneck. The rule of thumb here is to see whether your
processors are working at between 20% and 50%. If this usage is
consistently above 80% to 95%, you should consider splitting off some of
the workload or adding processors. Table 2 indicates some of the key Performance Monitor objects and counters for measuring processor utilization.
Table 2. Processor-Related Performance Objects and Counters
| Performance Monitor Object | Description |
|---|
| Processor: % Processor Time | The rate at which bytes are received on the interface. |
| System: Processor Queue Length | The
number of threads in the processor queue. A sustained processor queue
of greater than two threads indicates a processor bottleneck. |
| System: Threads | The
number of threads executing on the machine. A thread is the basic
executable entity that can execute instructions in a processor. |
| System: Context Switches | The
rate at which the processor and SQL Server has to change from executing
on one thread to executing on another. This costs CPU resources. |
| Processor: % Interrupt Time | The percentage of time that the processor spends receiving and servicing hardware interrupts. |
| Processor: Interrupts/sec | The average number of hardware interrupts the processor is receiving and servicing. |
The counters System: % Total Processor Time, System: Processor Queue Length, and Processor: % Processor Time
are the most critical to watch. If the percentages are consistently
high (above that 80% to 95% level), you need to identify which specific processes
and threads are consuming so many CPU cycles. The ideal Windows setup
is to run SQL Server on a standalone member server to the Windows
domain. You should not install SQL Server on a primary domain controller
(PDC) or backup domain controller (BDC) because the PDC and BDC run
additional services that consume memory, CPU, and network resources.
Before you upgrade to the latest processor just because the % Processor Time counter is constantly high, you might want to check the load placed on the CPU by your other devices. By checking Processor: % Interrupt Time and Processor: Interrupts/Sec, you can tell whether the CPU is interrupted more than normal by devices such as disk controllers.
The % Interrupt Time value should be as close to 0 as possible; controller cards should handle any processing requirements.
The System: Context Switches counter can
reveal when excessive context switching occurs, which usually directly
affects overall performance. In addition, the System: Threads
counter can give a good picture of the excessive demand on the CPU of
having to service huge numbers of threads. In general, you should look
at these counters only if processor queuing is happening.
By upgrading inefficient controllers to bus-mastering
controllers, you can take some of the load from the CPU and put it back
on the adapter. You should also keep the controller patched with the
latest drivers from the hardware vendor.
Monitoring Processor Performance in SSMS
The Activity Monitor in SSMS provides some basic information on processor performance, such as the % Processor Time that SQL Server is consuming and a list of the current user connections into SQL Server.
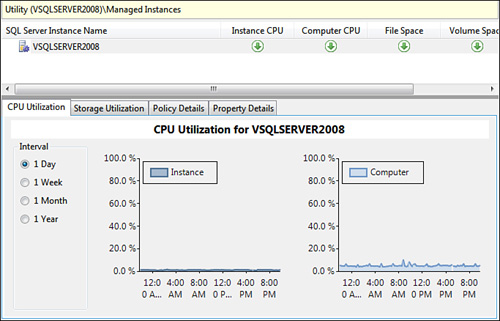
If you’ve enabled the SQL Server Utility for your SQL
Server instance, you can get a high-level view of CPU utilization on
the CPU Utilization page of the Utility Explorer (see Figure 2). This view displays CPU utilization for the SQL Server instance and the overall CPU utilization for the server.
If you are collecting performance data into the MDW
using the Data Collector for a SQL Server instance, you can view more
detailed CPU utilization and CPU wait information in the Server Activity
History report .
If you see high CPU utilization, you can click on the CPU Usage graph
to drill down and examine the details of the top 10 processes consuming
CPU resources.
If there is an indication of excessive CPU waits, you
can click on the SQL Server Waits graph to drill down into the details
regarding the queries experiencing high CPU waits.
Dynamic Management Views or System Views for Monitoring Processor Items
Within SQL Server, you can execute a simple SELECT statement that yields the SQL Server processes and their corresponding threads:
SELECT top 10 spid, lastwaittype, dbid, uid, cpu, physical_io, memusage,status,
       loginame, program_name
from sys.sysprocesses
ORDER BY cpu desc
This statement lists the top 10 CPU resource hogs
active in SQL Server. After you identify which processes are causing a
burden on the CPU, you can check whether they can be either turned off
or moved to a different server. If they cannot be turned off or moved,
you might want to consider upgrading the processor. The same information
is available via the new DMV:
SELECT top 10 session_id, command, database_id, user_id,
 cpu_time, reads,        writes, logical_reads
from sys.dm_exec_requests
order by cpu_time desc
Taking a peek at the SQL Server schedulers (using the sys.dm_os_schedulers DMV) also shows whether the number of runnable tasks is getting bogged down. If the runnable_tasks_count
values are nonzero, there aren’t enough CPU time slices available to
run the current SQL Server workload. The following example shows how you
query the dm_os_schedulers view for this information:
SELECT scheduler_id, current_tasks_count, runnable_tasks_count
FROM Sys.dm_os_schedulers
And finally, to get an idea of the top CPU hogs in SQL Server cached SQL and stored procedures, you can query the sys.dm_exec_query_stats DMV and aggregate on total_worker_time to get the total CPU consumption, as follows:
SELECT top 50 sum(total_worker_time) as Total_CPU,
              sum(execution_count) as Total_Count,
              count(*) as Total_Statements,
              plan_handle
FROM   sys.dm_exec_query_stats
GROUP BY plan_handle
Order by 1 desc
GO
To actually see the SQL code that is behind the plan_handle, you can execute the dm_exec_sql_text function to get your “hog” list:
SELECT total_worker_time, b.text
FROM sys.dm_exec_query_stats A
CROSS APPLY sys.dm_exec_sql_text (A.plan_handle) AS B
order by 1 desc
