In this exercise, you will create a swimlane diagram of the same process. In doing so, you will organize the work steps into role-based lanes to make responsibilities clear.
Note:
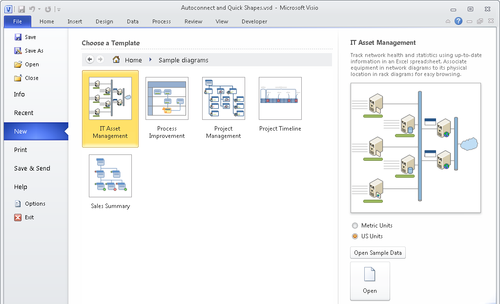
Click the File tab, and then click New.
-
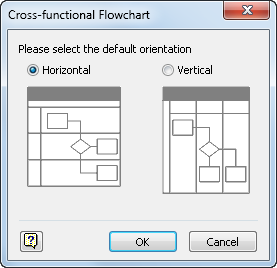
In the Template Categories section, click Flowchart, and then double-click the Cross-Functional Flowchart thumbnail. The orientation selection dialog box opens.
Tip:
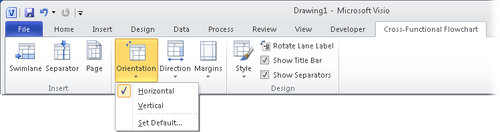
If you have previously selected a default orientation, this dialog box will not appear again. However, you can still change both the orientation of a single diagram and the default for future diagrams. On the Cross-Functional Flowchart tab, in the Arrange group, click the Orientation button and make your selection.

-
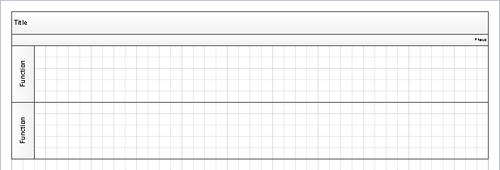
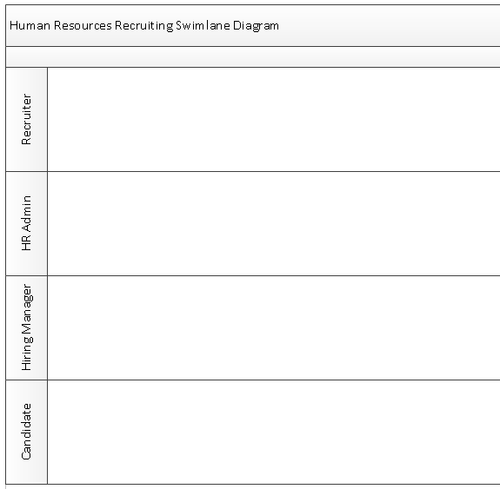
Click OK to select a Horizontal layout. The swimlane add-in places a title band and two swimlanes onto the drawing page.

Swim Lane 

-
On the Cross-Functional Flowchart tab, in the Insert group, click the Swimlane button twice to add two more lanes to your diagram.
Tip:
There are three other ways to add swimlanes, each of which is useful at various times:
-
Right-click the header of an existing lane, and Visio offers you a choice of adding a new swimlane above or below the one you’ve selected.
-
Drag a Swimlane shape from the stencil and drop it on top of an existing lane.
-
Point to the boundary between lanes, with the cursor just outside the swimlane structure, and click the blue insertion triangle.
You’ve probably already figured this out, but swimlane diagrams are so named because they resemble a swimming pool viewed from above.
-
-
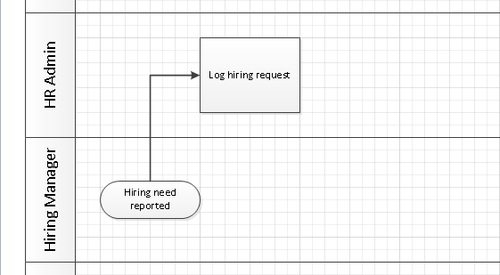
Type HR Admin as the title for the second swimlane, Hiring Manager for the third swimlane, and Candidate for the bottom swimlane.

-
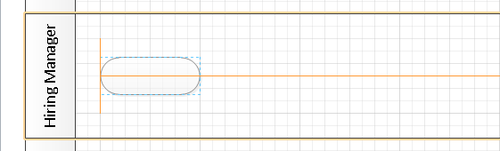
Drag a Start/End shape from the Basic Flowchart Shapes stencil onto the drawing page and use the Dynamic Grid to position it in the Hiring Manager lane.

-
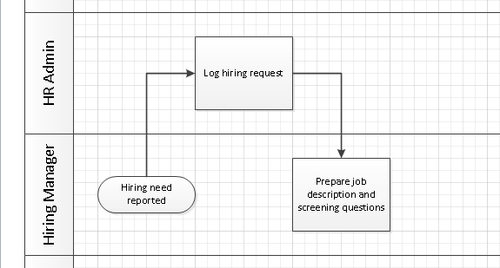
Click the start/end shape and type Hiring need reported.
-
Drag a Process shape into the HR Admin lane, dropping it to the right of the start/end shape, and then type Log hiring request.
Connector 

-
On the Home tab, in the Tools group, click the Connector button, and then draw a connector from the top of the Hiring need reported shape to the left side of the Log hiring request shape.
-
Use the Connector tool to link the previous process step to your new task.

-
Continue adding flowchart shapes to your diagram using the information in rows 4-10 of the following table. (Rows 1-3 represent the shapes you’ve already added.) As you add each shape, draw a connector from the previous row’s shape to the new shape.
-
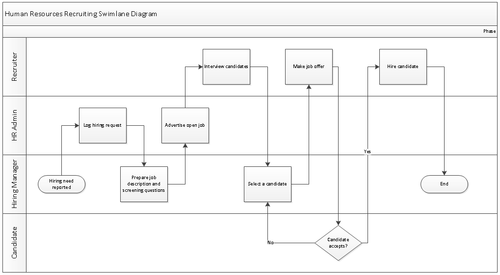
Click the connector from the Candidate accepts? shape to the Select a candidate shape and type No.
Your swimlane diagram should look something like the following graphic. It’s unlikely that your drawing will look exactly like this one because you probably made different decisions about placing and connecting shapes. However, after you have the general placement and connectivity correct, you can adjust and tweak your diagram to make it look the way you’d like.
If you think your diagram is too crowded, realize that the cross-functional flowchart template used the default paper size for your region.

Note:
Save the drawing as HR Recruiting Swimlane, and then close it.
One final note about the Visio 2010 take on cross-functional flowcharts: although the end result looks very much as it has in previous versions of Visio, the underlying structure is very different. In fact, structure is the operative word in the previous sentence. In Visio 2010, each swimlane is a container, and the overall framework is a list.