Now that you know how to use and modify existing data
fields and how to create new fields, the next logical step is to
explore ways to use all of that data.
Visio 2010 provides a
reporting facility that lets you extract data in a variety of ways in
order to summarize and present it. Many of the built-in Visio templates
include predefined reports. You can also design your own reports by
stepping through the provided report definition wizard.
In this exercise, you will run one of the built-in reports.
Shape Reports

On the Review tab, in the Reports group, click the Shape Reports button. The Reports dialog box opens.
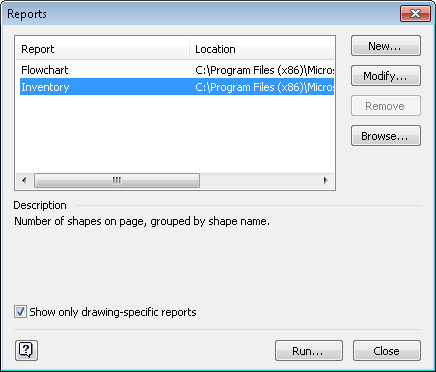
In the Reports dialog box, click once on Flowchart in the list of reports.
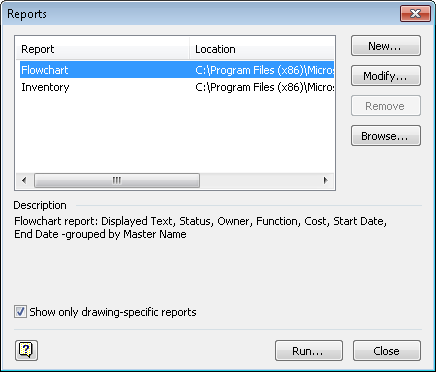
At the top of the Reports
dialog box, there are two predefined reports: Flowchart and Inventory.
The Flowchart report is part of the flowchart template in Visio and will
appear whenever you create a diagram using that template. The Inventory
report is a generic Visio report that counts shapes and is present
every time you open the Reports dialog box.
Because you selected the Flowchart report, notice that there is a description of the report in the center of the dialog box.
Click Run. The Run Report dialog box opens.
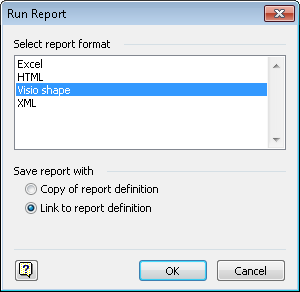
The Run Report dialog box offers four different report output options:
Excel Drops the formatted report data into Microsoft Excel. The report data can be edited.
HTML Drops the report into Windows Internet Explorer. This report format is read only.
Visio shape
Creates a new Visio shape that contains the report data. (For the
technically inclined: this shape is actually an embedded Excel object,
so after creating it, you can double-click the report shape and edit the
data as though you were using Excel.)
XML
Creates an XML file containing the formatted report. The report data
can be imported into an XML-aware application or can be edited.
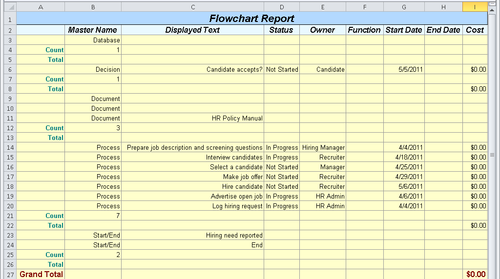
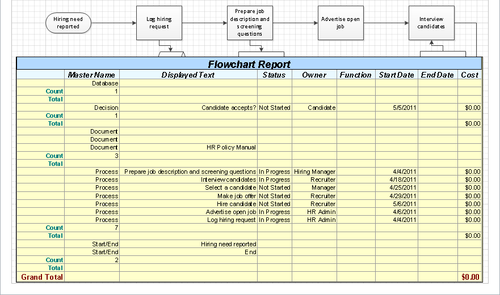
Click Excel, and then click OK to open the Flowchart report.
Tip:
This report includes subtotals for each entry in the Master Name column.
On the Review tab, in the Reports group, click the Shape Reports button. Then click Flowchart and the Run button in the Reports dialog box to run the Flowchart report again.
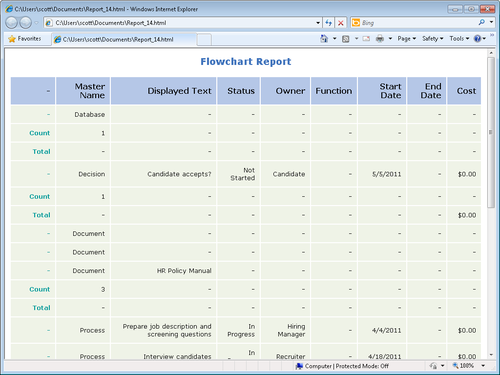
In the Run Report dialog box, click HTML, and then click OK. Internet Explorer opens and displays the report.
On the Review tab, in the Reports group, click the Shape Reports button. Then click Flowchart and the Run button in the Reports dialog box to run the Flowchart report again.
In the Run Report dialog box, click Visio shape, and then click OK.
As you can see in the following graphic, the new shape object can be
quite large, depending on the amount of data in your drawing, so you’ll
probably want to cut and paste it onto a separate page.
On the Review tab, in the Reports group, click Shape Reports.
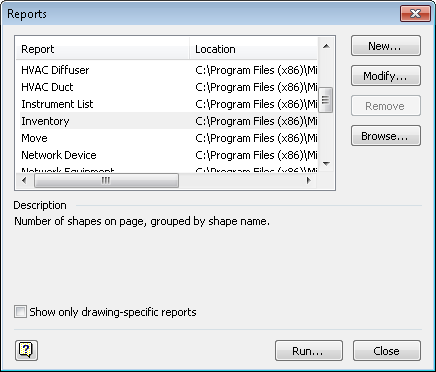
In the Reports dialog box, click Inventory. Notice the description of this report—essentially, it just counts all occurrences of every shape on the page.
Tip:
The Show Only
Drawing-Specific Reports option at the bottom of the dialog box is
selected by default. Generally, this is a good thing because it prevents
Visio from showing you a list of extraneous reports. However, if you’re
looking for a report that doesn’t appear on the list when this option
is selected, you can clear it. Doing so for the previous dialog box
produces a long list of reports.
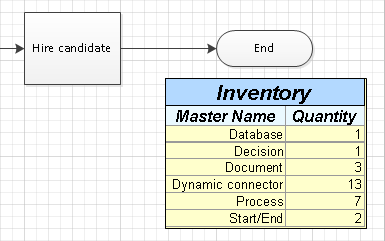
Double-click Visio shape in the Run Report dialog box to execute the report and create a new Visio shape.
In
the portion of the drawing page shown in the following graphic, the
inventory report displays a simple count of each shape type.
Note:
Save your changes to the HR Process Map Reports drawing but leave it open if you are continuing with the next exercise.
