Logo
programming4us
programming4us
programming4us
programming4us
Home
programming4us
XP
programming4us
Windows Vista
programming4us
Windows 7
programming4us
Windows Azure
programming4us
Windows Server
programming4us
Windows Phone
 
Windows Phone

Vector Graphics : Overlapping and ZIndex

- Free product key for windows 10
- Free Product Key for Microsoft office 365
- Malwarebytes Premium 3.7.1 Serial Keys (LifeTime) 2019
3/23/2011 6:20:26 PM
Here are two lines:
<Grid Background="LightCyan">
<Line X1="100" Y1="300"
X2="200" Y2="50"
Stroke="Blue" />

<Line X1="50" Y1="100"
X2="300" Y2="200"
Stroke="Red" />
</Grid>


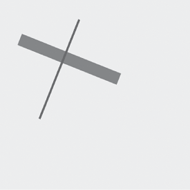
The second one overlaps the first one. You can see that more clearly if you go beyond the default 1-pixel thickness of the line using StrokeThickness:

<Grid Background="LightCyan">
<Line X1="100" Y1="300"
X2="200" Y2="50"
Stroke="Blue"
StrokeThickness="5" />

<Line X1="50" Y1="100"
X2="300" Y2="200"
Stroke="Red"
StrokeThickness="30" />
</Grid>


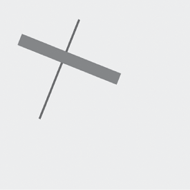
If you would prefer that the blue line be on top of the red line, there are two ways you can do it. You could simply swap the order of the two lines in the Grid:

<Grid Background="LightCyan">
<Line X1="50" Y1="100"
X2="300" Y2="200"
Stroke="Red"
StrokeThickness="30" />

<Line X1="100" Y1="300"
X2="200" Y2="50"
Stroke="Blue"
StrokeThickness="5" />
</Grid>


Or, you could set the Canvas.ZIndex property. Although this property is defined by Canvas it works with any type of panel:

<Grid Background="LightCyan">
<Line Canvas.ZIndex="1"
X1="100" Y1="300"
X2="200" Y2="50"
Stroke="Blue"
StrokeThickness="5" />

<Line Canvas.ZIndex="0"
X1="50" Y1="100"
X2="300" Y2="200"
Stroke="Red"
StrokeThickness="30" />
</Grid>


Other -----------------
- Vector Graphics : Canvas and Grid
- Vector Graphics : The Shapes Library
- Data Bindings : TextBox Binding Updates
- Data Bindings : Give and Take
- Data Bindings : Converters with Properties
- Data Bindings : Simple Decision Making
- Data Bindings : Setting the DataContext
- Data Bindings : A Simple Binding Server
- Data Bindings : Notification Mechanisms
- Data Bindings - The “this” Source
 
 
Top 10
- Microsoft Visio 2013 : Adding Structure to Your Diagrams - Finding containers and lists in Visio (part 2) - Wireframes,Legends
- Microsoft Visio 2013 : Adding Structure to Your Diagrams - Finding containers and lists in Visio (part 1) - Swimlanes
- Microsoft Visio 2013 : Adding Structure to Your Diagrams - Formatting and sizing lists
- Microsoft Visio 2013 : Adding Structure to Your Diagrams - Adding shapes to lists
- Microsoft Visio 2013 : Adding Structure to Your Diagrams - Sizing containers
- Microsoft Access 2010 : Control Properties and Why to Use Them (part 3) - The Other Properties of a Control
- Microsoft Access 2010 : Control Properties and Why to Use Them (part 2) - The Data Properties of a Control
- Microsoft Access 2010 : Control Properties and Why to Use Them (part 1) - The Format Properties of a Control
- Microsoft Access 2010 : Form Properties and Why Should You Use Them - Working with the Properties Window
- Microsoft Visio 2013 : Using the Organization Chart Wizard with new data
 
programming4us
Windows Vista
programming4us
Windows 7
programming4us
Windows Azure
programming4us
Windows Server