Before delving into the details of building
Reporting Services reports and creating ad hoc reporting models, you
should know the primary reporting concepts in Dynamics AX and have a
high-level understanding of how the Dynamics AX Reporting Framework is
designed. We discuss these topics in the following subsections.
What Is a Report?
A report is simply data from Dynamics AX
that has been rendered into human-readable form. For example, at its
simplest, a report could be a list of customers shown on the screen. A
report could also be a printed piece of paper containing details about
a specific customer. A Web page listing inventory is a report. A
Microsoft Office Excel worksheet showing all the statistics of on-time
deliveries is also a kind of report. This definition of a report is
broad, but it reflects the varied, real-world usage of reporting in
Dynamics AX.
Reporting and Users
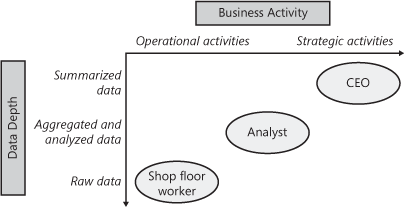
You can categorize reporting on two axes: data depth and business activity. As shown in Figure 1, the role users play in an organization and the reports they use fall at one point (or perhaps several points) on these axes.

Here are some details about the reporting needs of the roles shown in Figure 1:
A
CEO who is interested in monitoring the business periodically uses
strategic reports that provide summarized data across time periods.
An
analyst examines the business looking for patterns that might lead to
changing business plans and priorities and uses reports that allow the
data to be interactively sliced
by region or time period. This makes it easier to detect trends and
patterns, and the results of this analysis feed into the CEO’s
decisions.
A shop floor worker is
concerned with the day-to-day activities of the business and uses
reports that reflect the immediate needs of the shop floor. For
example, a shop floor worker would use a simple report that lists all
the items in the inventory.
Dynamics
AX reports help satisfy the needs of these users so that relative to an
individual’s role in the business, he or she has the data necessary to
be effective.
Providing Reports in Dynamics AX 2009
Dynamics
AX 2009 supports both production reports and ad hoc reports. Production
reports, which can range from simple to complex, are designed and
created by developers. Ad hoc reports are generally simpler and created
directly by users, without help from developers.
Note
In Latin, ad hoc
means “for this,” and the term indicates something done, often
impromptu, for a specific purpose. In the context of Dynamics AX
reporting, an ad hoc report is very specific to the needs of the user
who created it. |
Report Categories
Dynamics AX 2009 reports fall within three general categories:
Production
reports that use one of the two reporting platforms—MorphX or Reporting
Services—supported by Dynamics AX 2009. Developers create these reports
because of their complexity.
Ad hoc
reports built on MorphX or Reporting Services. Once developers and
administrators have put ad hoc reporting models in place, users can
create their own ad hoc reports.
Ad hoc reports that access Dynamics AX data directly.
Note
Read more about the MorphX and Reporting Services platforms used for Dynamics AX 2009 reporting later in this section. |
Kinds of Reports in Dynamics AX 2009
Table 1 lists the different kinds of reports available in Dynamics AX 2009 and some characteristics of each.
Table 1. Kinds of Reports Available in Dynamics AX 2009
| Type of Report | Production Reporting? | Ad Hoc Reporting? | Reporting Platform | Report Creation Tool |
|---|
| MorphX production reports | Yes | No | MorphX | MorphX tools |
| Reporting Services production reports | Yes | N/A | Reporting Services | Visual Studio 2008 |
| Auto reports | No | Yes | MorphX | Dynamics AX client |
| Reporting Services ad hoc reports | N/A | Yes | Reporting Services | SQL Report Builder |
| Export list page to Excel | No | Yes | N/A—direct access to Dynamics AX | Dynamics AX client and Excel |
| Connect Excel to Dynamics AX cube | No | Yes | N/A—direct access to Dynamics AX | Excel |
Reporting Platforms in Dynamics AX 2009
Dynamics
AX 2009 integrates with two reporting platforms: MorphX, the Dynamics
AX–specific reporting platform, and Reporting Services (SQL Server
Reporting Services), which is the Microsoft standard reporting platform.
MorphX
has been the traditional Dynamics AX reporting platform since the first
version of the product and has been supporting customer needs for a
long time. Starting with Dynamics AX 2009, Reporting Services is
considered the primary reporting platform for the product.
Microsoft
decided to shift to Reporting Services as the standard reporting
platform for Dynamics AX rather than standardizing on MorphX, which is
a proprietary reporting platform, for several reasons, including these:
Advantages
from the availability of a much larger pool of resources, including
developers, partners, and training partners who are already familiar
with Reporting Services and Visual Studio.
It aligns with the overall direction in Microsoft to standardize on Reporting Services.
Here are some of the features that Reporting Services offers that are unavailable in MorphX:
|
Dynamics
AX 2009 is the first release that features integration with Reporting
Services. Here are some suggestions for gently introducing Reporting
Services reports to your business:
Start experimenting with the Reporting Services technology and features. Pick some simple existing MorphX-based reports and create Reporting Services versions of them. When a new production report has to be written, create it using Reporting Services if possible. Replace an existing production report with one of the several ad hoc reporting features available.
|
Report Entry Points
Users
can view reports in Dynamics AX 2009 from several locations. When
working in the Dynamics AX client, users can view reports in the
following ways:
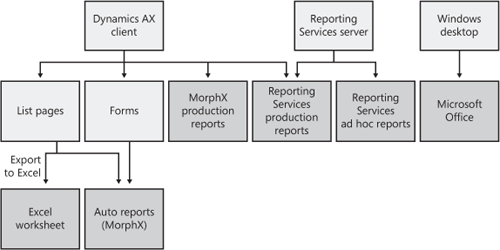
Export data from a Dynamics AX list page into an Excel worksheet.
View and print an auto report, which Dynamics AX can automatically build from any list page or form the user sees.
Launch MorphX production reports or Reporting Services production reports from menu items.
Even when users are not working in the Dynamics AX client, they can view reports in these ways:
Go to the Reporting Services Report Manager Web site to locate and launch production reports or ad hoc reports directly.
Start Excel and connect it to a Dynamics AX cube to analyze Dynamics AX OLAP data via Excel pivot tables.
Figure 2 is a conceptual depiction of how users can access the different kinds of reports available in Dynamics AX.
