Logo
programming4us
programming4us
programming4us
programming4us
Home
programming4us
XP
programming4us
Windows Vista
programming4us
Windows 7
programming4us
Windows Azure
programming4us
Windows Server
programming4us
Windows Phone
 
Windows Server

SQL Server 2008 : Data Collector and MDW - Reporting

- Free product key for windows 10
- Free Product Key for Microsoft office 365
- Malwarebytes Premium 3.7.1 Serial Keys (LifeTime) 2019
10/7/2012 3:40:45 PM
In closing our coverage of the data collection platform, let's take a look at the standard reports. Each of these can be accessed in SQL Server Management Studio by right-clicking Data Collection and choosing Reports > Management Data Warehouse. The data shown in the resultant report will be filtered for the server from which the report was run. Let's start with the Disk Usage Summary report.

1. Disk Usage Summary

The initial view of the Disk Usage Summary report, as shown in figure 1, presents a view of each database's disk usage within the instance.
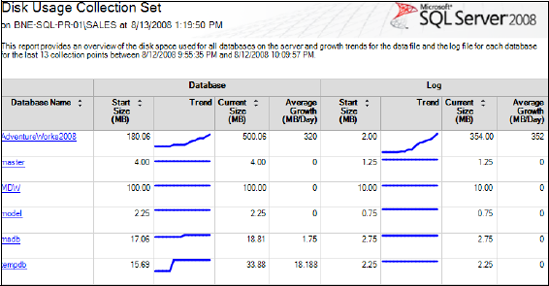
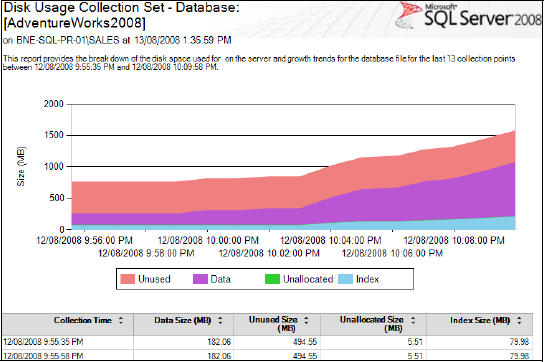
Figure 1. The Disk Usage report includes trend lines and average growth per day for both data and log files.
 

Figure 2. Drilling down from the Disk Usage report provides further detail on disk usage, in this case, for the data file of the AdventureWorks2008 database.
 

The value of this report is enhanced through the ability to click on the blue trend lines to drill down into more detail. For example, clicking on the AdventureWorks2008 database trend line opens another report, as shown in figure 2.

The clear visibility of historical disk usage enabled by the Disk Usage reports makes capacity planning in SQL Server 2008 much simpler than in SQL Server 2005 and earlier, which required a custom process and/or a third-party product.

Next up, let's examine the Query Statistics History report.

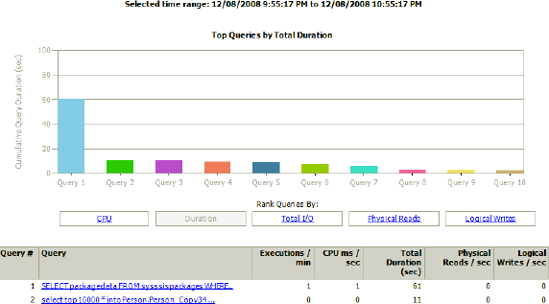
2. Query Statistics History

The Query Statistics History report permits analysis of the most expensive queries 
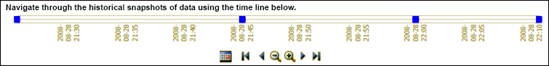
(by duration, CPU, or disk usage). As with the Server Activity report, you can select a particular period in which to filter the report using the timeline navigation, as shown in figure 3.

Figure 3. The timeline at the top of certain reports allows the report to be filtered for a time period.
 

A section of the Query Statistics report is shown in figure 4.

The value of this report is enhanced by the ability to drill down into the details of each query. For example, clicking on one of the queries brings up another report, as shown in figure 5. Among other details, this report shows aggregated query statistics and the full query text.

Additional drill-through actions from this report provide further detail, all the way down to viewing the individual graphical execution plans.

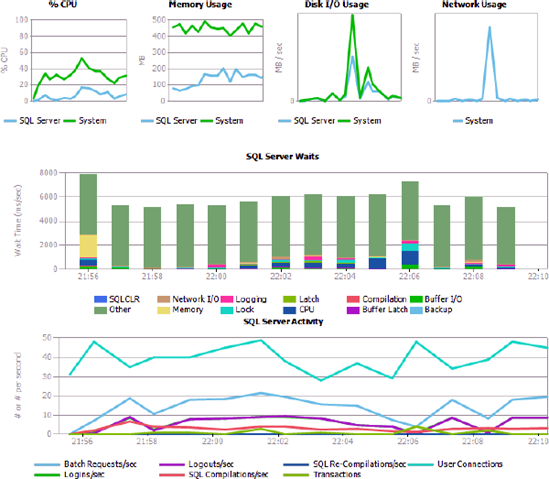
The final report we'll examine is the Server Activity History report.

Figure 4. The Query Statistics report allows the most expensive queries to be identified for a time period. Clicking on the query provides further details, such as the full query text and execution plan.
 

Figure 5. Drilling through from the Query Statistics report shows additional query details such as execution count and average duration per execution.
 

.3. Server Activity History

As shown in figure 6, the Server Activity History report provides a wealth of information for a selected time period, including resource usage, wait types, and performance counter values.

Like the other reports we've looked at, the Server Activity report enables drill-through action into more detail, such as clicking on the Disk I/O Usage graph line and viewing the details of each disk, as shown in figure 7.

Bear in mind that all of the reports shown here are standard, out-of-the-box reports that work with the standard system collection sets. Thus, the ability to derive a deeper understanding of system usage not only is very simple but comes with a relatively low administration overhead.

In addition to these standard reports, you can create custom reports as well.

Figure 6. Server activity for a time period
 

Figure 7. Drilling through from the Server Activity report enables a deeper analysis, in this case viewing each disk's response time, queue length, and transfer rate.
 

4. Custom reports

These tables can be directly queried as part of a custom report for a custom collection set or to enhance the standard reports, for example, to include data from multiple instances side by side. Further possibilities for customization exist, for example, to create Analysis Services cubes off the collected data.

Other -----------------
- Windows Server 2008 Server Core : Locating Information in Files with the Find and FindStr Utilities
- Windows Server 2008 Server Core : Finding Files and Directories with the Dir Command
- Microsoft Dynamics GP 2010 : Preventing posting errors by managing Batch dates
- Microsoft Dynamics GP 2010 : Getting control of Outlook features on the Home page, Reducing out-of-balance problems with Allow Account Entry
- Preventing Errors in Dynamics GP : Ensuring entry in the correct company by warning about Test Companies, Protecting Dynamics GP with key security settings
- SQL Server 2008 R2 : Managing Databases (part 2) - Detaching and Attaching Databases
- SQL Server 2008 R2 : Managing Databases (part 1) - Managing File Growth, Expanding Databases, Shrinking Databases
- SQL Server 2008 R2 : Setting Database Options
- Windows Server 2003 on HP ProLiant Servers : Introduction to ProLiant Servers (part 6) - System Management
- Windows Server 2003 on HP ProLiant Servers : Introduction to ProLiant Servers (part 5) - Server Deployment
 
 
Top 10
- Microsoft Visio 2013 : Adding Structure to Your Diagrams - Finding containers and lists in Visio (part 2) - Wireframes,Legends
- Microsoft Visio 2013 : Adding Structure to Your Diagrams - Finding containers and lists in Visio (part 1) - Swimlanes
- Microsoft Visio 2013 : Adding Structure to Your Diagrams - Formatting and sizing lists
- Microsoft Visio 2013 : Adding Structure to Your Diagrams - Adding shapes to lists
- Microsoft Visio 2013 : Adding Structure to Your Diagrams - Sizing containers
- Microsoft Access 2010 : Control Properties and Why to Use Them (part 3) - The Other Properties of a Control
- Microsoft Access 2010 : Control Properties and Why to Use Them (part 2) - The Data Properties of a Control
- Microsoft Access 2010 : Control Properties and Why to Use Them (part 1) - The Format Properties of a Control
- Microsoft Access 2010 : Form Properties and Why Should You Use Them - Working with the Properties Window
- Microsoft Visio 2013 : Using the Organization Chart Wizard with new data
 
programming4us
Windows Vista
programming4us
Windows 7
programming4us
Windows Azure
programming4us
Windows Server