Logo
programming4us
programming4us
programming4us
programming4us
Home
programming4us
XP
programming4us
Windows Vista
programming4us
Windows 7
programming4us
Windows Azure
programming4us
Windows Server
programming4us
Windows Phone
 
programming4us
Windows 7

Microsoft Access 2010 : Building Powerful Reports - The Anatomy of a Report

- Free product key for windows 10
- Free Product Key for Microsoft office 365
- Malwarebytes Premium 3.7.1 Serial Keys (LifeTime) 2019
1/23/2015 8:28:29 PM

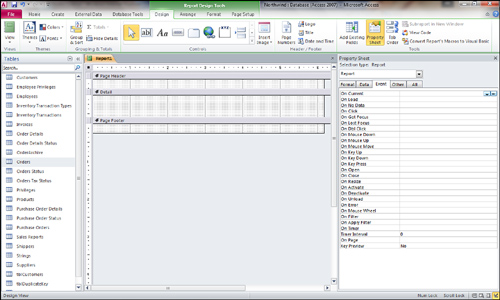
Reports can have many parts, referred to as sections of the report. A new report is automatically made up of the following three sections, as shown in Figure 1:

  • Page Header section

  • Detail section

  • Page Footer section

Figure 1. Sections of a report.

The Detail section is the main section of the report; it’s used to display the detailed data of the table or query underlying the report. Certain reports, such as Summary reports, have nothing in the Detail section. Instead, Summary reports contain data in group headers and footers.

The Page Header section automatically prints at the top of every page of the report. It often includes information such as the report’s title. The Page Footer section automatically prints at the bottom of every page of the report and usually contains information such as the page number and date. Each report can have only one page header and one page footer.

In addition to the three sections that Access automatically adds to every report, a report can have the following sections:

  • Report Header section

  • Report Footer section

  • Group Headers section

  • Group Footers section

A report header prints once, at the beginning of the report; the report footer prints once, at the end of the report. Each Access report can have only one report header and one report footer. The report header is often used to create a cover sheet for a report. It can include graphics or other fancy effects to add a professional look to a report. The most common use of the report footer is for grand totals, but it can also include any other summary information for a report.

In addition to report and page headers and footers, an Access report can have up to 10 group headers and footers. Report groupings separate data logically and physically. The group header prints before the detail for the group, and the group footer prints after the detail for the group. For example, you can group customer sales by country and city, printing the name of the country or city for each related group of records. If you total the sales for each country and city, you can place the country and city names in the country and city group headers and the totals in the country and city group footers.

Other -----------------
- Microsoft Visio 2013 : Adding Sophistication to Your Drawings - Grouping shapes
- Microsoft Visio 2013 : Adding Sophistication to Your Drawings - Inserting fields: the basics
- Microsoft Visio 2013 : Adding Sophistication to Your Drawings - Using shape data
- Microsoft Visio 2013 : Adding Sophistication to Your Drawings - Adding ScreenTips and comments
- Microsoft Visio 2013 : Adding Sophistication to Your Drawings - Positioning shape text
- Automating Windows 7 Installation : Using Windows System Image Manager (part 3) - Creating an Unattended Answer File
- Automating Windows 7 Installation : Using Windows System Image Manager (part 2) - Exploring the Components of an Answer File
- Automating Windows 7 Installation : Using Windows System Image Manager (part 1) - An Overview of WSIM, Understanding Catalog Files
- Personalizing and Configuring Windows 7 : Performance Tweaks (part 4) - Improving Windows 7's Memory
- Personalizing and Configuring Windows 7 : Performance Tweaks (part 3) - Monitoring Performance and Reliability
 
 
Top 10
- Microsoft Visio 2013 : Adding Structure to Your Diagrams - Finding containers and lists in Visio (part 2) - Wireframes,Legends
- Microsoft Visio 2013 : Adding Structure to Your Diagrams - Finding containers and lists in Visio (part 1) - Swimlanes
- Microsoft Visio 2013 : Adding Structure to Your Diagrams - Formatting and sizing lists
- Microsoft Visio 2013 : Adding Structure to Your Diagrams - Adding shapes to lists
- Microsoft Visio 2013 : Adding Structure to Your Diagrams - Sizing containers
- Microsoft Access 2010 : Control Properties and Why to Use Them (part 3) - The Other Properties of a Control
- Microsoft Access 2010 : Control Properties and Why to Use Them (part 2) - The Data Properties of a Control
- Microsoft Access 2010 : Control Properties and Why to Use Them (part 1) - The Format Properties of a Control
- Microsoft Access 2010 : Form Properties and Why Should You Use Them - Working with the Properties Window
- Microsoft Visio 2013 : Using the Organization Chart Wizard with new data
 
programming4us
Windows Vista
programming4us
Windows 7
programming4us
Windows Azure
programming4us
Windows Server