When you launch Dashboard Designer, the main Dashboard Designer screen consists of the following elements:
A ribbon with three tabs: Home, Edit, and Create (see Figure 1)
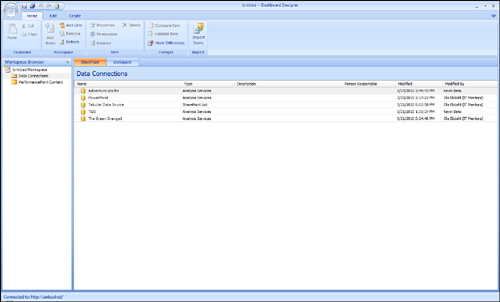
Workspace Browser pane on the left
SharePoint tab that displays a view of the items that have been deployed to SharePoint
Workspace tab that displays a view of the items that exist in the local workspace
When you select an item
from the Workspace Browser on the left, the screen changes to include a
view of the item in the workspace and a Details pane on the right, as
shown in Figure 2.
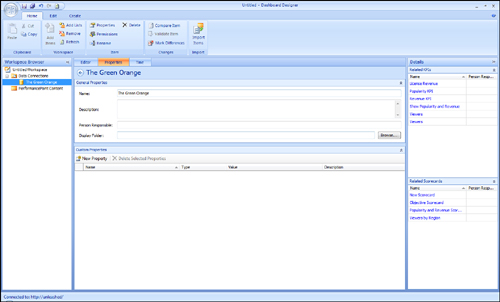
The Details pane appears when you select a workspace item such as a KPI, scorecard, or data source. In the example shown in Figure 2,
you see the settings for The Green Orange Data Connection in the center
of the screen. On the right, the Details pane provides information on
The Green Orange item.
Examining First Class Objects
Dashboard Designer allows you to work with first class objects. First class objects
are items that you can manage in Dashboard Designer and reuse in
different dashboards. The following items are considered first class
objects:
Dashboards: A compilation of KPIs, scorecards, reports, and filters. A dashboard is deployed to SharePoint.
Scorecards: A compilation of KPIs.
KPIs:
KPIs enable you to measure the success of your organization, project,
employees, and products. This is done by defining a goal or target value
that is compared to an actual value.
Filters:
Filters enable you to filter dashboard items so that you can view only
select items. The filter values can be almost anything. For example, you
can filter by time, region, employee, or product.
Indicators:
Visual element associated with your KPIs that enables you to determine
the status of a KPI. A classic example of an indicator is the red,
yellow, and green traffic light indicator.
Data Sources:
PPS enables you to connect to the following data sources: Analysis
Services, Excel Services, Excel Workbook, SharePoint List, and SQL
Server Table/View.
Reports:
Reports enable you to visualize data using charts such as bar and line
charts. Types of reports include analytic grid, analytic chart, strategy
map, KPI details, and Reporting Services. Other reports include Excel
Services, ProClarity Analytics server page, and web page.
Note
All objects that you create
are stored in a database. Objects cannot be deployed until they have
been saved to the database. You can also save a workspace locally as a
Dashboard Designer Workspace (DDWX) file.
Examining the Home Tab
The Home tab is made up of the following sections:
Clipboard
Workspace
Item
Changes
Import
The Home tab is context
sensitive, which means the options available will vary depending on the
item you select. This section covers only the most important options in
the Home tab.
Workspace Section
The Workspace section of the Home tab offers the following options, among others (see Figure 3):
Add Items:
Enables you to add an item and its related items to the local
workspace. If you add a scorecard, the KPIs, data sources, and
indicators that the scorecard uses will also be added. This option,
which is context sensitive, will activate when you have objects
highlighted in the SharePoint tab.
Add Lists:
Enables you to add a SharePoint list to the workspace. You cannot
create a new list. Instead, the list has to exist in SharePoint.
Refresh:
Enables you to refresh the contents of a list. Use this option to
update the contents of your local workspace to include items that have
been added to a SharePoint list.
Item Section
The Item section of the Home tab offers the following options among others:
Properties: This option enables you to open the item’s properties page in SharePoint.
Permissions:
Opens the item’s permissions page in SharePoint. Because all Dashboard
Designer items are SharePoint list items, the permissions from its
parent, which is a site in this case, will apply. If necessary, you can
break the inheritance.
Delete: Enables you to delete an item from either the local or SharePoint workspace.
Changes Section
The Changes section of the Home tab offers the following options:
Compare Item:
Compare an item in the workspace with the latest saved version in
SharePoint. This will produce a detailed report of property value
differences between the workspace item and the SharePoint item.
Validate Item:
Checks that all data sources are valid and available for the item you
select. For example, you can use this option to verify that data is
available for all the KPIs on a scorecard.
Mark Differences: Enables you to mark items in the local workspace that have a different property value compared to the SharePoint item.
Import Section
The Import section of the Home tab offers the following option:
You can import
content from different SharePoint lists on the same site, from different
site collections on the same server, from a different SharePoint farm,
or from a custom created DDWX file.
The
DDWX file format is created by serializing PPS objects from the
SharePoint content database into a simple XML structure. It is possible
to do custom editing of DDWX files before importing them. This proves
useful if you want to do bulk editing of content and are comfortable
working with XML.
Caution
The import feature in PPS
2010 works differently than the import feature in PPS 2007. In PPS 2007,
you simply connected to a new server and republished the objects to
import. In PPS 2010, the database and content are hosted natively in
SharePoint. To import content, you must use the import user interface in
Dashboard Designer.
