If you are going off to war
(Performance and Tuning war), you should not come empty handed. Bring
all your heaviest artillery. In other words, make sure you have plenty
of performance and tuning tools to help you diagnose and resolve your
issues (to fight your war).There are tools you can use
out of the box from Microsoft as well as plenty of third-party tools
that will help you shed much light on any issues you may be having. In
the following sections, we outline a few of both so you can see various
methods of getting to the heart of your performance and tuning problems.
Some tools are highly graphic and easy to use; others are more
text-based and require much more effort and organizing. But you need to
come prepared to fight the war. Do not wait until you have a performance
problem in your production environment to learn how to use one of these
tools or to have bought a performance and tuning tool. Get what you
need upfront.
Microsoft Out-of-the-Box
Microsoft continues to offer
some built-in capabilities around performance and tuning with tools
such as SQL Server Profiler, Data Collection Services, Performance
Monitor counters that monitor many of the execution aspects of SQL
Server, and plenty of SQL options at the server level to ensure optimal
execution.
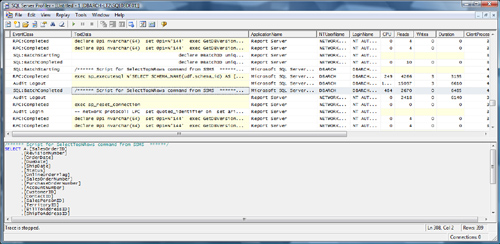
SQL Server Profiler— This rock-solid Microsoft-bundled offering is slowly getting better and better. As you can see in Figure 6,
the SQL statements across a SQL Server instance are captured along with
the execution statistics and other performance handles. You can save
your traces and even import them into SQL Server tables for analysis by
sorting the raw SQL code into the Top 10 (or 100) worst-performing
queries.
Other Microsoft tools— As
mentioned previously, you can also use other tools such as Perfmon
counters to isolate locking, deadlocking, memory utilization, CPU
utilization, cache hit ratios, physical and logical disk I/Os, disk
queue lengths, and a host of others. This includes counters for database
mirroring execution, data replication execution, and many others.
Third-Party Performance and Tuning Tools
There are a number of
performance monitoring and tuning tools available for third-party
vendors. Here, we list a few that we have some personal experience with:
Precise 8.5—
For database and other tier monitoring in one package, Precise TPM
(formerly Precise i3 from Symantec but spun out a few years ago) is one
of the best out there. It’s a bit pricey, but for larger organizations
that have vast implementations, investing in this type of holistic
toolset can pay dividends. See www.precise.com for a current release of database and J2EE monitoring capabilities.
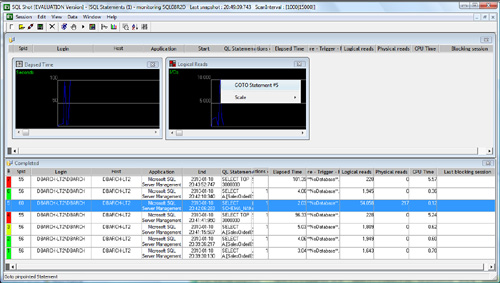
SQL Shot—
This tool uses a different approach from Microsoft. In particular, SQL
Shot bubbles up all SQL Server–based execution information into a
cockpit of visuals (or graphics). Figure 7 shows how easy it is to see trouble spots in your SQL Server–based system by using SQL Shot’s main GUI. See www.dbarchitechs.com for a current release of the SQL Server 2008 R2 version.
Proactive DBA SQL Capture— This
tool provides no-impact database monitoring of end-user response times
and SQL activity. SQL Capture works by “sniffing” network SQL
conversations between clients and SQL Server, gathering a wide variety
of metrics on the SQL executed by clients. Capturing can occur right on
the target server for convenient, low-impact monitoring or on a separate
machine for true, no-impact capturing of database activity. You can log
all or only selected SQL details to a repository database of your
choice and/or to operating system flat files for later viewing and
analysis. See www.proactivedba.com for more detailed information on the current release.
Idera SQL Diagnostic Monitor SQL—
This performance monitoring and diagnostics solution can proactively
alert administrators to health, performance, or availability problems
within their SQL Server environment, all from a central console. In
addition to real-time monitoring and analysis, current versions also
provide the History Browser, which allows you to diagnose historical SQL
Server performance problems by selecting a historical point-in-time to
view. See www.idera.com for information on the current release.
Again,
come to the war with all your weapons. This is critical work, and you
need to make great performance and tuning decisions, be able to isolate
issues quickly, and uncover even the most complex problems.
