The majority of reports you create will probably be
based on data from more than one table. This is because a properly
normalized database usually requires that you bring table data back
together to give users valuable information. For example, a report that
combines data from a Customers table, an Orders table, an Order Details
table, and a Product table can supply the following information:
Customer information, such as company name and address
Order information, such as order date and shipping method
Order detail information, such as quantity ordered and price
A product table, including a product description
You can base a multitable report directly on the
tables whose data it displays, or you can base it on a query that has
already joined the tables, providing a flat table structure.
Creating One-to-Many Reports
You can create a one-to-many report by using the
Report Wizard, or you can build a report from scratch. Different
situations require different techniques, some of which are covered in
the following sections.
Build a One-to-Many Report by Using the Report Wizard
Building a one-to-many report with the Report Wizard is quite easy. You just follow these steps:
1. | Select Report Wizard from the Reports group on the Create tab of the Ribbon.
|
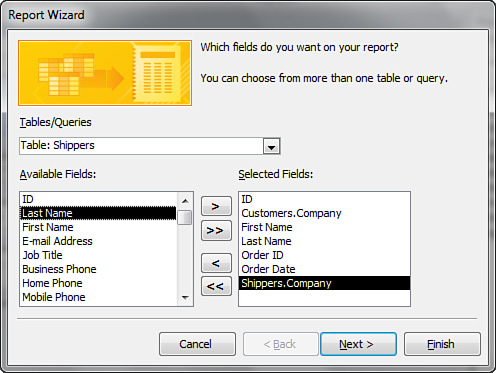
2. | From the Tables/Queries drop-down list box, select the first table or query whose data will appear on the report.
|
3. | Select the fields you want to include from that table.
|
4. | Select each additional table or query you want to include on the report, selecting the fields you need from each (see Figure 1). Click Next.
|
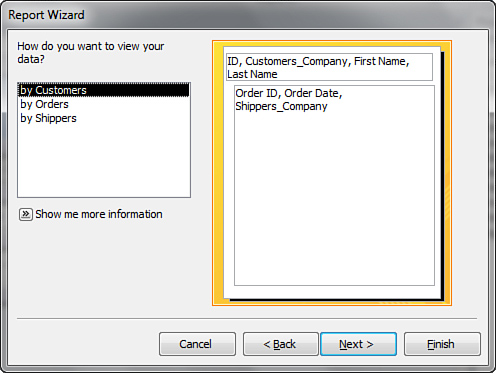
5. | The next step of the Report Wizard asks you how you want to view the data (see Figure 2).
You can accept Access’s suggestion (by Customers), or you can choose
from any of the available options (by Customers, by Orders, or by
Shippers). Click Next.
|
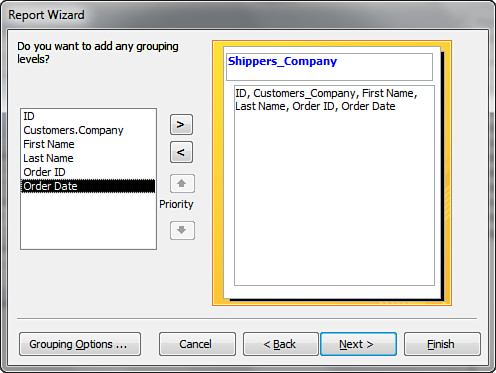
6. | The
next step of the Report Wizard asks whether you want to add any
grouping levels. You can use grouping levels to visually separate data
and to provide subtotals. In the example in Figure 3, the report is grouped by Shippers Company. After you select grouping levels, click Next.
|
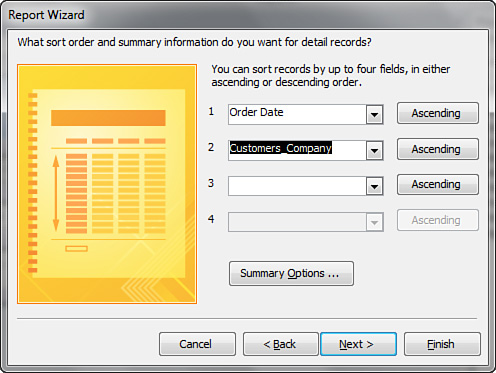
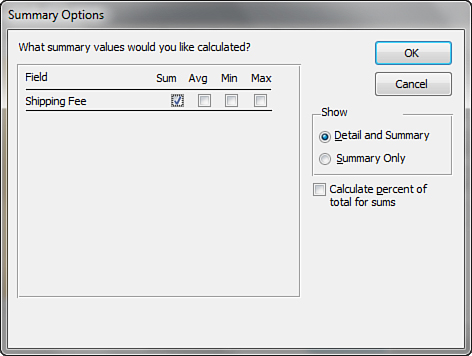
7. | The next step of the Report Wizard lets you select how you want the records in the report’s Detail section to be sorted (see Figure 4). This step of the wizard also allows you to specify any summary calculations you want to perform on the data (see Figure 5).
Click the Summary Options button to specify the summary calculations.
By clicking the Summary Options button, you can even opt to include the
percentage of total calculations. Click OK when you have finished
adding the summary options.
|
8. | In
the next step of the Report Wizard, you select the layout and
orientation of the report. Layout options include Stepped, Blocked,
Outline 1, Outline 2, Align Left 1, and Align Left 2. You can click the
different option buttons to preview how each of the reports will look.
|
9. | In
the next step of the Report Wizard, you select a title for the report.
The title also becomes the name of the report. I like to select an
appropriate name and change the title after the wizard is finished. The
final step also allows you to determine whether you want to immediately
preview the report or see the report’s design first. Click Finish when
you are ready to complete the process.
|
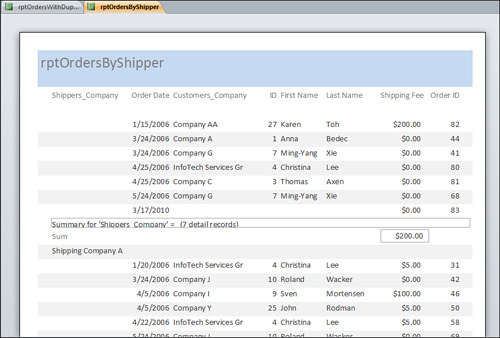
The report created in this example is shown in Figure 6.
Notice that the report is sorted and grouped by Shippers Company,
OrderDate, and Customers Company. The report’s data is in order by
OrderDate and Customers Company within a Shippers Company grouping.
This
method of creating a one-to-many report is by far the easiest. In fact,
the “background join” technology that the wizards use when they allow
you to pick fields from multiple tables—figuring out how to build the
complex queries needed for the report or form—is one of the major
benefits of Access as a database tool. It’s a huge timesaver and helps
hide unnecessary complexity from you as you build a report. Although
you should take advantage of this feature, it’s important that you know
what’s happening under the covers. The following two sections give you
this necessary knowledge.
