Pulling Out a Pie Slice
A
pie chart is an effective and easily understood chart type for
comparing parts that make up a whole entity, such as departmental
percentages of a company budget. You can call attention to individual
pie slices that are particularly significant by moving them away from
the other pieces, or exploding the pie. Not only will this make a visual impact, it will also restate the values you are graphing.
Explode a Pie Slice
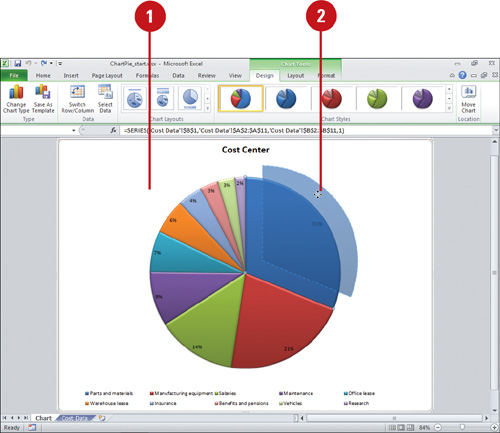
 Select a pie chart.
 To explode a single slice, double-click to select the pie slice you want to explode.
 Drag the slice away from the pie.
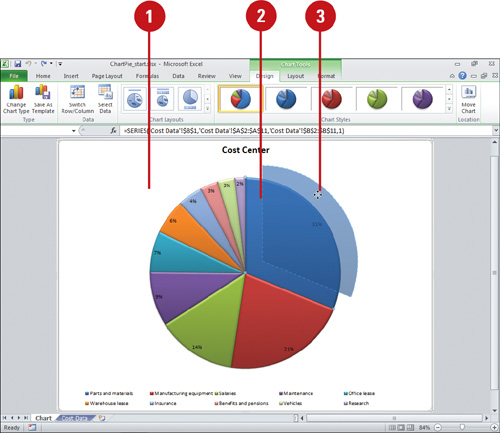
 Release the mouse button.
You can select a pie slice to make it stand out.
Because a pie chart has only one data series, clicking any slice
selects the entire data series. Click a second time to select a specific
slice.
Undo a Pie Explosion
- Select a pie chart.
- Drag a slice toward the center of the pie.
- Release the mouse button.
Formatting Chart Data Series
If
you want to further enhance a chart, you can insert a picture in a
chart so that its image occupies a bar or column. You can use the Format
Selection button to open the Format dialog box and change Fill options
to format a chart data series with a solid, gradient, picture, or
texture fill. In addition, you can also change a chart data series with a
border color, border style, shadow, and 3-D formats, which include
bevel, depth, contour, and surface styles.
Format a Chart Data Series
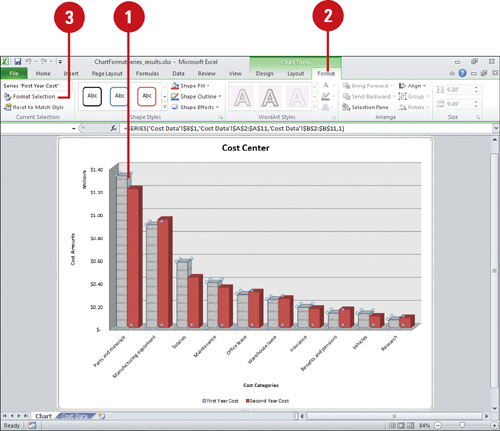
- Select the chart series you want to modify.
- Click the Format tab under Chart Tools.
- Click the Format Selection button.
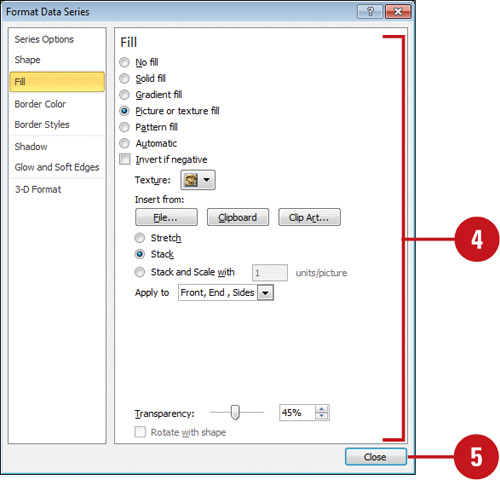
- Select the options you want:
- Series Options to change the gap width and depth (for 3-D charts), or series overlap (for 2-D charts).
- Shape to change the shape to a box, pyramid, cone, or cylinder (for 3-D charts).
- Fill to remove or change the fill, either solid color, gradient, picture, or texture.
- Border Color or Styles to remove or change the border color and styles, either solid or gradient line.
- Shadow to change shadow options, including color, transparency, size, blur, angle, and distance.
- 3-D Format to change 3-D format options, including bevel, depth, contour, and surface.
 Click Close.