Refreshing Pivot Table Data
When
you create a pivot table, Excel takes a snapshot of your data source and
stores it in a pivot cache. A pivot cache is a special memory
container. This is what your pivot table is connected to. This means
that your pivot table report and your data source are disconnected.
The benefit of this is
optimization. Any changes you make to the pivot table report, such as
rearranging fields, adding new fields, or hiding items, are made rapidly
and with minimal overhead. However, because your pivot table is working
from a snapshot of your data source, any changes you make to your data
are not picked up by your pivot table report until you take another
snapshot. This is called “refreshing” your pivot table.
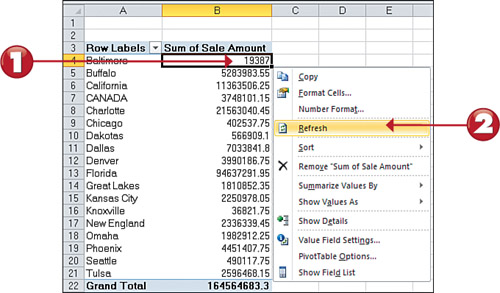
1. Right-click anywhere in your pivot table.
2. Select the Refresh option.
Note: The PivotTable Tools Contextual Tab
When
you click on your pivot table, Excel activates the PivotTable Tools
contextual tab. There, you see an Options tab and a Design tab. Click
the Options tab and choose the Refresh command. These tabs expose a
variety of commands you can use to manage and work with pivot tables. |
Adding a Report Filter
Often
times, you’re asked to produce reports for one particular region,
market, product, and so on. Instead of working hours and hours building
separate reports for every possible analysis scenario, you can leverage
pivot tables to help create multiple views of the same data. For
example, you can do so by creating a region filter in your pivot table.
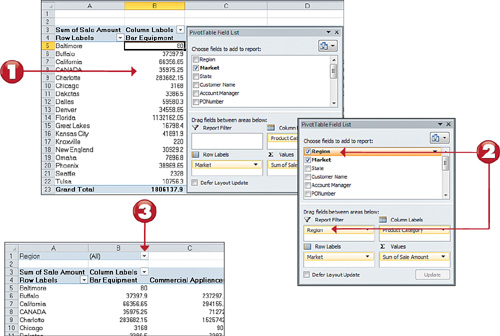
1. Click anywhere on your pivot table to reactivate the PivotTable Field List.
2. Find the Region field, click it and drag it to the Report Filter area in the Pivot Table Field List.
3. Note that your pivot table now has a filter drop-down for Region.
Tip: Using a Field’s Context Menu to Move It
In
addition to dragging, you can also move a field into the different areas
of the pivot table by clicking the black triangle next to the field
name and then selecting the desired area. |
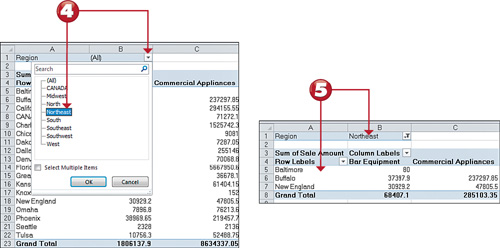
4. Once you have a report filter on your pivot table, you can click the filter drop-down and select the desired data item.
5. Note how the pivot table responds by showing you only the data for the selected item.
Tip: Selecting Multiple Data Items
When you click the filter drop-down to select a data item, you will notice a check box labeled Select Multiple Items. Clicking this check box allows you to select more than one data item by which you can filter your report. |
Adding Pivot Table Data
Sometimes,
the data source that feeds your pivot table changes in structure. For
example, you may have added or deleted rows or columns from your data
table. These types of changes affect the range of your data source, not
just a few data items in the table. In these cases, performing a simple
Refresh of your pivot table won’t do. You have to update the range being
captured by the pivot table.
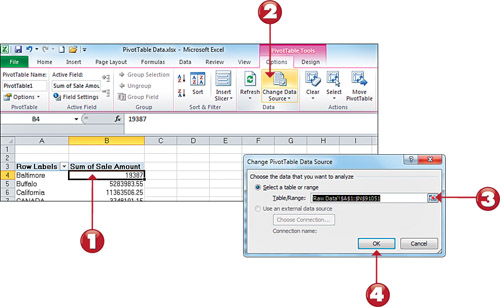
1. Click anywhere in your pivot table to activate the PivotTable Tools contextual tab.
2. Select the Change Data Source command in the Options tab.
3. The Change PivotTable Data Source dialog box activates. Here, you supply the new data range for the pivot table.
4. Click the OK button to confirm the change. Your pivot table automatically refreshes to show the newly referenced data.
