Creating Data Graphics
Creating your own Data
Graphics is a simple process that involves mapping Shape Data fields to
Data Graphic items. One issue to keep in mind is which types of data
work best with which types of items. Data bars and color by value are
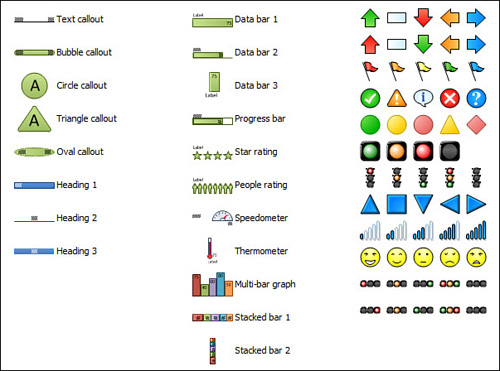
best used with numerical values. Text callouts obviously are best for
textual descriptions and names. Icon sets work well for data that fits
a small number of distinct regions such as “pass” and “fail” or
“low,”“medium,” and “high.”
To get you up and running, Visio provides you with the premade text callouts, data bars, and icon sets shown in Figure 3.
Creating a Custom Data Graphic
1. | Continue with Ch7 Shape Data.vsd.
|
2. | Create
a new, blank page called DG and drop a few Light Bulb shapes on it.
Make sure they have different information either by manually editing
the Shape Data fields or using Link Data methods described in the
previous section.
|
3. | Go
to the Data tab, expand the Data Graphics gallery, and then click
Create New Data Graphic. The New Data Graphic dialog appears, with no
items in it.
|
4. | Click New Item. The New Item dialog appears.
|
5. | For
the Data field, choose Power (Watts), and for Displayed As, choose Data
Bar. Pick any style of bar you would like from the Style drop-down.
|
6. | Notice
the Details section, which allows you to fine-tune the look and
behavior of the data bar. For now, focus on the minimum and maximum
values. In this case, 0 and 100 are good choices for light bulbs, but
make sure that your bulbs fall within this range and use it fully. If
your maximum Wattage is only 30, you might change the maximum value to
that number instead.
|
7. | Leave
the default settings for Position, which governs where on the shape the
Data Graphic Item will be located. You can come back and experiment
with this later.
|
8. | Click
OK to exit the New Item dialog. You see your new item displayed in the
list, summarizing that Power (Watts) is being displayed as a data bar.
|
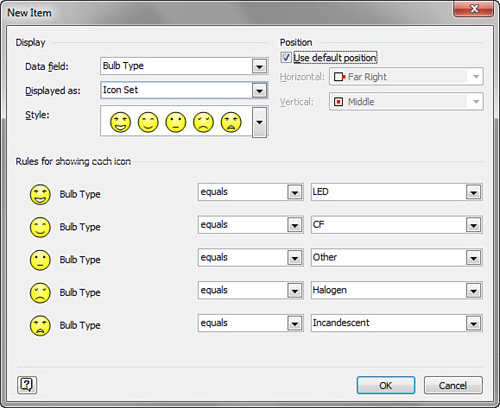
9. | Click
New Item again; then choose to display Bulb Type as an icon set. Pick
any style from the drop-down and then look at the Rules for Showing
Each Icon section. This section allows you to specify when to show each
icon from the set.
|
10. | Icon
sets can display up to five icons, representing five different values.
Amazingly, you have exactly five different types of Bulb Types: CF,
Halogen, Incandescent, LED, and Other.
Unfortunately, Visio doesn’t pick up on the fact that Bulb Type is a
fixed list and offer a convenient drop-down list for the conditions.
You have to type CF, Halogen, Incandescent, LED, and Other
into the far-right field for each icon. Do this now and make sure that
the condition is “equals” in the middle drop-down for each icon. Figure 4 shows how it should look.
Click OK twice to exit the dialogs for creating your new Data Graphic.
You see your new item in the Data Graphics drop-down gallery on the
Data tab. |
11. | Rename
your Data Graphic. The Data Graphics drop-down is purely visual, but
the icons you see aren’t always clear enough—especially if you define
several similar Data Graphics.
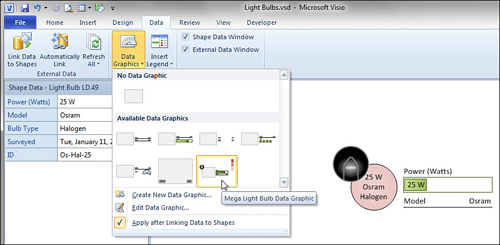
If you pause the mouse pointer over an item, a ToolTip appears showing
the name. Visio gives Data Graphics odd default names, but you can
choose your own. Figure 5 shows the application of the Mega Light Bulb Data Graphic, which loudly hints that I created and named it myself!
Rename your new Data Graphic by right-clicking it and choosing Rename.
If you’ve just added the Data Graphic, it should be the last one in the
list. |
12. | Save the drawing, as usual.
|
Applying Data Graphics to Shapes
Applying
Data Graphics to shapes is simply a matter of selecting the shapes you
want and then picking Data Graphics from the Data Graphics drop-down
list. You probably figured this out from Figure 5, where you renamed the Data Graphic.
The Data Graphics gallery is wired with Live
Preview, so you can pause over an item, and Visio shows you how it will
look in the drawing window before you click. This capability is
especially helpful if you’ve created several similar Data Graphics. You
can use Live Preview to help in choosing the right one.
Of course, you can remove Data Graphics at any time
by selecting shapes and choosing the top item in the gallery, just
under No Data Graphic. All Data Graphics are removed from the selected
shapes.
Another helpful feature enables you to find the
shapes that are using a particular Data Graphic. Just right-click on
any item in the gallery and click Select Shapes That Use This Data
Graphic. Any shapes on the page that use that particular Data Graphic
are selected. You can now easily apply a different Data Graphic to just
these shapes or clear the Data Graphic by applying No Data Graphic.
