Being able to store extra data behind Visio
shapes extends the utility of drawings and makes them useful as
interactive tools. The ability to report on this data adds even more
value to Visio drawings.
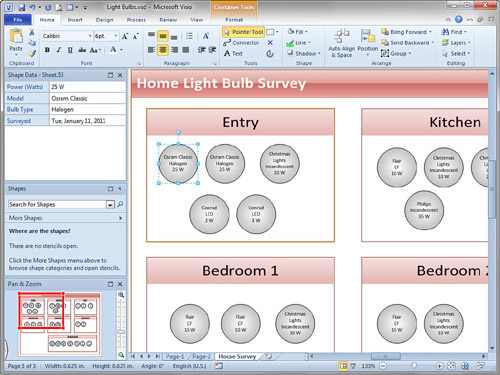
For example, you can use the light bulb shapes as a “visual data entry system.” Figure 1
shows the light bulb shapes being used in a “home energy inventory”
diagram. I found it easier to make sure that I got every light in our
house by going room by room and adding a light bulb shape for each
actual light. Seeing an actual shape on the diagram in the proper room
container was easier and less error-prone than managing an abstract
matrix in Excel.
You
could even go whole-hog by adding the light bulbs to an actual floor
plan of your house and locating each bulb shape where a real-life lamp
exists. This approach is great for big inventories, such as in an
office space. For our small abode, however, the containers were
sufficient.
1. Introducing the Report Definition Wizard
No matter what kind of drawing you’ve created, after
you have shapes with data-filled fields, you might want to create a
report. The simple light bulb shapes are a great place to start in
getting to know how to do this.
Defining a Simple Light Bulb Inventory Report
1. | Continue working with Ch7 Shape Data.vsd.
|
2. | Add a new page and rename it to Basic Report.
|
3. | Copy
a shape from the Light Bulbs page and paste it to this page. Create
several copies of it, each with different types, wattages, etc., to
make the report more interesting.
|
4. | On the Review tab, click Shape Reports. The Reports dialog appears.
I personally think that Review tab is an odd place for the Shape
Reports button. If you think you’ll be using reports often, right-click
the button and add it to the Quick Access Toolbar.
|
5. | Note
the solitary Inventory report shown in the report list. If you uncheck
the Show Only Drawing-Specific Reports check box, the list of reports
grows considerably.
Visio includes many template-specific reports but filters the list by
looking at the available Shape Data fields in the shapes of your
drawing. Because Visio reports focus largely on Shape Data fields,
there’s no sense in listing reports that tally fields that your shapes
don’t have.
|
6. | Start a new report definition. Click New. The Report Definition Wizard starts.
- a. Check Select Shapes on the Current Page.
- b. If
your drawing contains shapes that aren’t light bulbs, they will cause
blank rows in the report. You can add a filter to the report to prevent
this. Click Advanced. The Advanced filtering dialog appears.
- c. Select Bulb Type from the Property list.
- d. Select Exists from the Condition list.
- e. Select True for the Value.
- f. Click Add.
- g. You can also add Power (Watts) Exists = True if you like, but for this exercise, it’s probably not necessary.
- h. Click OK to complete the filtering.
|
7. | Click
Next to get to the column-selection page of the wizard. You see a list
of shape properties (in brackets), along with Shape Data fields that
exist in shapes in the drawing. Here you can choose to report on the
type of bulb and the energy use. Ignore the model and surveyed fields
for now.
Check Bulb Type and Power (Watts) and then click Next.
|
8. | Enter a report title, such as Light Bulb Power Use and copy this text because you’ll need it again for the report name. The report title shows in the generated table.
|
9. | Ignore the Subtotals, Sort, and Format buttons for now and click Next.
|
10. | In the “Save the report definition” screen, paste the report title into the Name field.
|
11. | Check
“Save in this drawing” and then click Finish. You return to the Reports
starting screen. You see your new report in the list of reports, along
with a location of “Visio Drawing,” indicating that the report is
stored in the drawing file itself. You can now run this report on any
page that contains light bulb shapes.
|
12. | Click Close for now, and save your drawing.
|
Running a Report
1. | Continue working with Ch7 Shape Data.vsd, and go to the Basic Report page.
|
2. | On the Review tab, click Shape Reports. The Reports dialog appears. Select Light Bulb Power Use in the list.
|
3. | Click Run. The Run Report dialog appears, offering you choices on how to output the report.
|
4. | Select
Visio Shape as the target for the report. This generates an embedded
Microsoft Excel object that lists the light bulb data for the current
page.
|
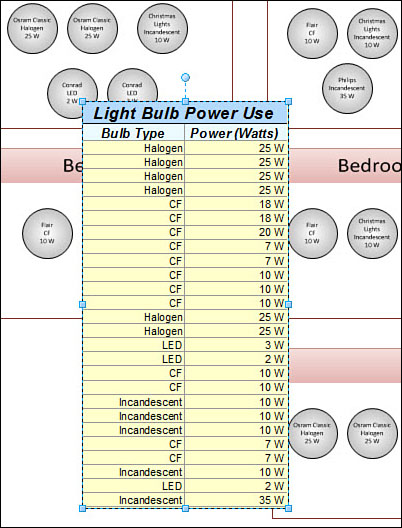
5. | Check
Link to Report Definition and then click OK. The report runs, and a
report shape is created with a listing of light bulb shape types and
power ratings, as shown in Figure 2.
|
6. | Double-click
the report shape. The report becomes an in-place activated Excel
object. The Ribbon changes to Excel’s Ribbon, and you can edit the
individual cells of the report as you normally would in Excel.
|
7. | Press Esc or click on a blank region of the page to exit Excel editing mode.
|
8. | If
you change the data in the drawing, you can rerun the report. Select
one of the light bulb shapes in the drawing and then copy it a whole
bunch of times.
|
9. | Right-click
the report shape and choose Run Report. The length of the report is
much longer, reflecting all the extra shapes you’ve just created. |
10. | Save the drawing so you can continue using it. |
