3. Data Collector Sets and Reports
Previous versions of Windows enabled you to log performance counter data and view it
later. Windows Vista and Windows 7 greatly expand this capability. Now you can create a data
collector set to log the following types of information:
Performance counters and alerts (just like in previous versions of Windows)
Event trace data showing detailed debugging information
Registry settings showing system and application configuration
After running a data collector set, you can view the performance counters in Performance
Monitor and you can view a summary of the other collected information in a report. The sections
that follow describe how to create data collector sets and how to use reports.
3.1. Built-in Data Collector Sets
Windows 7 includes several built-in data collector sets located at Performance\Data Collector Sets\System:
System Performance Logs processor, disk, memory, and
network performance counters and kernel tracing. Use this data collector set when troubleshooting a slow computer or intermittent performance problems.
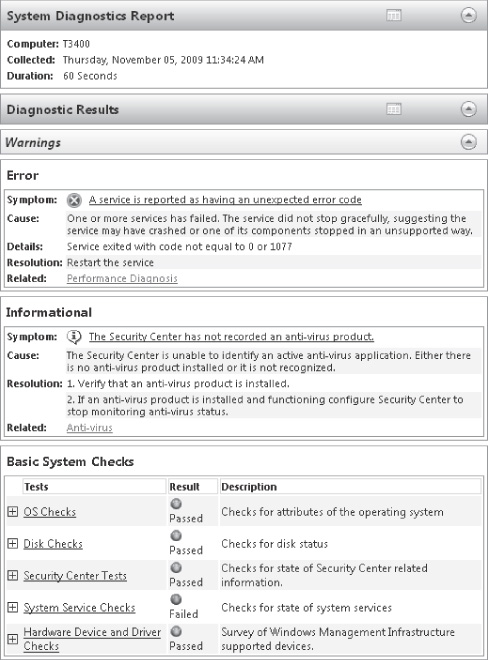
System Diagnostics Logs all the information included in
the System Performance data collector set, plus detailed system information. Use this data
collector set when troubleshooting reliability problems such as problematic hardware, driver
failures, or Stop errors. As shown in Figure 5 the
report generated by the data collector set provides a summary of error conditions on the
system without requiring you to browse Event Viewer and Device Manager manually.
To use a data collector set, right-click it, and then click Start. The System Performance
data collector set stops automatically after a minute, and the System Diagnostics data
collector set stops automatically after 10 minutes. To stop a data collector set manually,
right-click it, and then click Stop.
After running a data collector set, you can view a summary of the data gathered in the
Performance\Reports node. To view the most recent report for a data collector set,
right-click the data collector set, and then click Latest Report. Reports are named
automatically using the format
<Computer_Name>_yyyymmdd-######.
To minimize the performance impact of data logging, log the least amount of information
required. For example, you should use System Performance instead of System Diagnostics
whenever possible because System Performance includes fewer counters.
When a problem is difficult to reproduce and is not performance-related, you should err
on the side of logging too much data to minimize the chance that you will miss important
information.
3.2. How to Create a Data Collector Set Using a Standard Template
You can save performance data to a log and then view and analyze the data in Performance
Monitor at any time. It's important to create a baseline by logging
performance data before making changes that you think might have a performance impact. After
making the changes, you can compare new performance data to the original performance data to
determine whether your changes were beneficial. If you don't have a baseline available when a
problem appears, you can create one using a different computer with a similar configuration
that does not have the problem.
To save performance data, follow these steps:
Under Performance, expand Data Collector Sets.
Right-click User Defined, click New, and then click Data Collector Set.
The Create New Data Collector Set Wizard appears.
On the How Would You Like To Create This New Data Collector Set? page, type a name for
the set. Make sure Create From A Template is selected. Then, click Next.
On the Which Template Would You Like To Use? page, choose from one of the three
standard templates (or Browse to select a custom template) and click Next:
Basic Logs all Processor performance counters, stores
a copy of the HKLM\Software\Microsoft\Windows NT\CurrentVersion registry key, and performs
a Windows Kernel Trace.
System Diagnostics Logs 13 useful performance counters
(including processor, disk, memory, and network counters), stores a copy of dozens of
important configuration settings, and performs a Windows Kernel Trace. By default, System
Diagnostics logs data for one minute, giving you a snapshot of the computer's
status.
System Performance Logs 14 useful performance counters
(including the same counters logged by the System Diagnostics template) and performs a
Windows Kernel Trace. System Performance logs data for one minute.
On the Where Would You Like The Data To Be Saved? page, click Next to accept the
default location for the data (%Systemdrive%\Perflogs\Admin).
On the Create The Data Collector Set page, leave Run As set to <Default>
to run it using the current user's credentials, or click Change to specify other
administrative credentials. Select one of three options before clicking Finish:
Open Properties For This Data Collector Set
Immediately customize the Data Collector Set.
Start This Data Collector Set Now Immediately begin
logging data without customizing the Data Collector Set.
Save And Close Close the Data Collector Set without
starting it. You can edit the properties and start it at any time after saving it.
Custom data collector sets are always available under the User Defined node within
Data Collector Sets.
3.3. How to Create a Custom Data Collector Set
After creating a new data collector set, you can modify it to log additional data sources
by right-clicking the data collector set, clicking New, and then clicking Data Collector to
open the Create New Data Collector wizard. On the What Type Of Data Collector Would You Like
To Create? page, type a name for the data collector, select the type, and then click
Next.
You can choose from the following types of data collectors (each of which provides
different options in the Create New Data Collector wizard):
Performance Counter Data Collector Logs data for any performance counter available when using the Performance
Monitor console. You can add as many counters as you like to a data collector. You can
assign a sample interval (15 seconds, by default) to the data collector.
Event Trace Data Collector Stores events from an event
trace provider that match a particular filter. Windows 7 provides dozens of event trace
providers that are capable of logging even the most minute aspects of the computer's
behavior. For best results, simply add all event trace providers that might relate to the
problem you are troubleshooting. If the data collector logs a large amount of unnecessary
data, you can use the provider properties to filter which trace events are stored.
Configuration Data Collector Stores a copy of specific
registry keys, management paths, files, or the system state. If you are troubleshooting
application problems or if you need to be aware of application settings, add the registry
keys using a configuration data collector. To add a management path, file, or system state,
create the data collector without specifying a registry key using the wizard. Then, view the
new data collector properties, and select the Management Paths, File Capture, or State
Capture tab.
Performance Counter Alert Generates an alert when a
performance counter is above or below a specified threshold.
You can add as many data collectors to a data collector set as required.
3.4. How to Save Performance Data
After creating a data collector set, you can gather the data specified in the Data Collector Set by right-clicking it and clicking Start. Depending on the
settings configured in the Stop Condition tab of the data collector set's Properties dialog
box, the logging might stop after a set amount of time or it might continue indefinitely. If
it does not stop automatically, you can manually stop it by right-clicking it and clicking
Stop.
3.5. How to View Saved Performance Data in a Report
After using a data collector set to gather information and then stopping the data
collector set, you can view the gathered information. To view a summary of the data saved
using a data collector set, right-click the data collector set and then click Latest Report.
The console expands the Reports node and selects the report generated when the data collector
set ran. You can expand each section to find more detailed information.
If the data collector set included performance counters, you can also view them using the Performance Monitor snap-in
by following these steps:
Under Performance, expand Monitoring Tools, and then select Performance Monitor.
Click the Action menu, and then click Properties. In the Performance Monitor Properties
dialog box, click the Source tab. You can also click the View Log Data button on the toolbar
or press Ctrl+L.
Under Data Source, select Log Files. Then, click Add. By default, Windows 7 stores data
collector set data in the C:\Perflogs\ folder. Browse to select the data collector set data
(the folder corresponds to the report name), and then click Open.
If you want, click Time Range and narrow the range of data you want to analyze.
In Performance Monitor, click the green Add button on the toolbar and add counters to
the chart. Because you specified a data source, you can add only counters that were
logged.
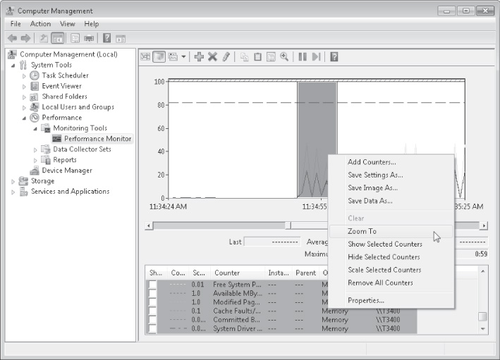
Performance Monitor shows the logged data instead of real-time data. To narrow the time
range shown, click and drag your cursor over the graph to select a time range. Then,
right-click the graph and click Zoom To, as shown in Figure 6.
The horizontal bar beneath the graph illustrates the currently selected time range.
Drag the left and right sides of the bar to expand the selected time range. Then,
right-click the graph and click Zoom To again to change the selection.