When
you’re displaying thick lines, you might want a little different
appearance on the ends of the lines. These are known as line caps—“caps” like a hat. The available caps are members of the PenLineCap enumeration: Flat (the default), Square, Round, and Triangle. Set the StrokeStartLineCap property to one of these values for the cap at the beginning of the line, and set StrokeEndLineCap for the cap at the end. Here are Round and Triangle capping off a 30-pixel line:
<Grid Background="LightCyan">
    <Polyline Points=" 50 100, 300 200,
                      300 400"
              Stroke="HotPink"
              StrokeThickness="30"
              StrokeStartLineCap="Round"
              StrokeEndLineCap="Triangle" />
</Grid>

The difference between Flat and Square
might not be obvious at first. To better clarify the difference, the
following markup displays a thinner line over the thick line with the
same coordinates to indicate the geometric start and end of the line:
<Grid Background="LightCyan">
    <Polyline Points=" 50 100, 300 200,
                      300 400"
              Stroke="HotPink"
              StrokeThickness="30"
              StrokeStartLineCap="Flat"
              StrokeEndLineCap="Square" />

    <Polyline Points=" 50 100, 300 200,
                      300 400"
              Stroke="Black" />
</Grid>
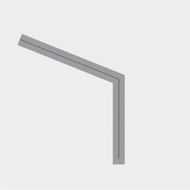
The Flat cap (at the upper left) cuts off the line at the geometric point. The Square extends the line for half the line thickness. My favorite caps are the rounded ones:
<Grid Background="LightCyan">
    <Polyline Points=" 50 100, 300 200,
                      300 400"
              Stroke="HotPink"
              StrokeThickness="30"
              StrokeStartLineCap="Round"
              StrokeEndLineCap="Round" />

    <Polyline Points=" 50 100, 300 200,
                      300 400"
              Stroke="Black" />
</Grid>
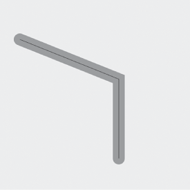
As you can see, they also extend the rendered size of the line by half the stroke thickness.
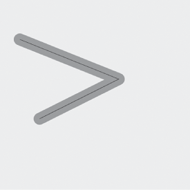
You can also specify what happens at the corners. Set the StrokeLineJoin property to a member of the PenLineJoin enumeration. Here’s Round:
<Grid Background="LightCyan">
    <Polyline Points=" 50 100, 300 200,
                      100 300"
              Stroke="HotPink"
              StrokeThickness="30"
              StrokeStartLineCap="Round"
              StrokeEndLineCap="Round"
              StrokeLineJoin="Round" />

    <Polyline Points=" 50 100, 300 200,
                      100 300"
              Stroke="Black" />
</Grid>
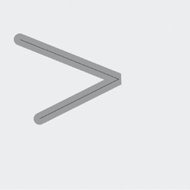
Or Bevel:
<Grid Background="LightCyan">
    <Polyline Points=" 50 100, 300 200,
                      100 300"
              Stroke="HotPink"
              StrokeThickness="30"
              StrokeStartLineCap="Round"
              StrokeEndLineCap="Round"
              StrokeLineJoin="Bevel" />

    <Polyline Points=" 50 100, 300 200,
                      100 300"
              Stroke="Black" />
</Grid>
Or Miter, which is the default:
<Grid Background="LightCyan">
    <Polyline Points=" 50 100, 300 200,
                      100 300"
              Stroke="HotPink"
              StrokeThickness="30"
              StrokeStartLineCap="Round"
              StrokeEndLineCap="Round"
              StrokeLineJoin="Miter" />

    <Polyline Points=" 50 100, 300 200,
                      100 300"
              Stroke="Black" />
</Grid>
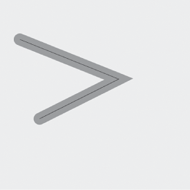
The Miter
join has a little built-in problem. If the lines meet at a very sharp
angle, the miter can be very long. For example, a 10-pixel wide line
that makes an angle of 1° will have a miter point over 500 pixels long!
To avoid this type of weirdness a StrokeMiterLimit property kicks in for extreme cases:
<Grid Background="LightCyan">
    <Polyline Points="50 230, 240 240,
                      50 250"
              Stroke="HotPink"
              StrokeThickness="30"
              StrokeStartLineCap="Round"
              StrokeEndLineCap="Round"
              StrokeLineJoin="Miter" />

    <Polyline Points="50 230, 240 240,
                      50 250"
              Stroke="Black" />
</Grid>
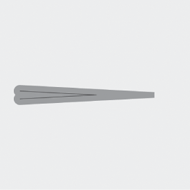
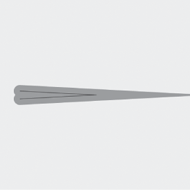
The default value is 10 (relative to half the StrokeThickness) but you can make it longer if you want:
<Grid Background="LightCyan">
    <Polyline Points="50 230, 240 240,
                      50 250"
              Stroke="HotPink"
              StrokeThickness="30"
              StrokeStartLineCap="Round"
              StrokeEndLineCap="Round"
              StrokeLineJoin="Miter"
              StrokeMiterLimit="50" />

    <Polyline Points="50 230, 240 240,
                      50 250"
              Stroke="Black" />
</Grid>
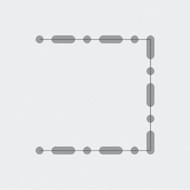
Here are two lines, one
thick, one thin overlaying the thick line, with the same geometric
points, going from the upper-left to the lower-left:
<Grid Background="LightCyan">
    <Polyline Points="100 100, 380 100,
                      380 380, 100 380"
              Stroke="HotPink"
              StrokeThickness="30"
              StrokeStartLineCap="Round"
              StrokeEndLineCap="Round"
              StrokeLineJoin="Round" />

    <Polyline Points="100 100, 380 100,
                      380 380, 100 380"
              Stroke="Black" />
</Grid>

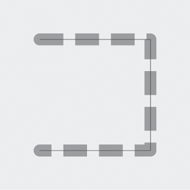
You can make the line dashed by setting the StrokeDashArray, which is generally just two numbers, for example 1 and 1:
<Grid Background="LightCyan">
    <Polyline Points="100 100, 380 100,
                      380 380, 100 380"
              Stroke="HotPink"
              StrokeThickness="30"
              StrokeStartLineCap="Round"
              StrokeEndLineCap="Round"
              StrokeLineJoin="Round"
              StrokeDashArray="1 1" />

    <Polyline Points="100 100, 380 100,
                      380 380, 100 380"
              Stroke="Black" />
</Grid>
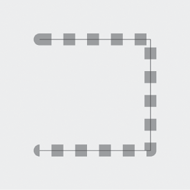
What this means is that a dash
will be drawn for one-line thickness (30 pixels in this case), followed
by a one-line thickness gap, and repeated until the end. As you can see,
the caps are
really handled a little differently; they are drawn or not drawn
depending on whether they occur when a dash or a gap is in progress.
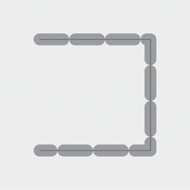
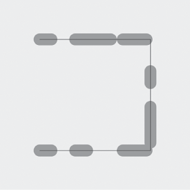
You can make the dashes longer by increasing the first number,
<Grid Background="LightCyan">
    <Polyline Points="100 100, 380 100,
                      380 380, 100 380"
              Stroke="HotPink"
              StrokeThickness="30"
              StrokeStartLineCap="Round"
              StrokeEndLineCap="Round"
              StrokeLineJoin="Round"
              StrokeDashArray="2 1" />

    <Polyline Points="100 100, 380 100,
                      380 380, 100 380"
              Stroke="Black" />
</Grid>
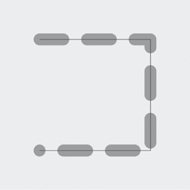
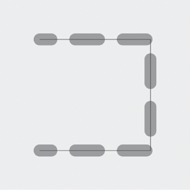
However, you’ll probably also want to give the dashes their own caps. Set StrokeDashCap to a member of the PenLineCap enumeration, either Flat (the default), Triangle, Square, or Round, which is my preference:
<Grid Background="LightCyan">
    <Polyline Points="100 100, 380 100,
                      380 380, 100 380"
              Stroke="HotPink"
              StrokeThickness="30"
              StrokeStartLineCap="Round"
              StrokeEndLineCap="Round"
              StrokeLineJoin="Round"
              StrokeDashArray="2 1"
              StrokeDashCap="Round" />

    <Polyline Points="100 100, 380 100,
                      380 380, 100 380"
              Stroke="Black" />
</Grid>
A little problem has arisen.
Each of the dashes has acquired a rounded cap, so they’ve each
increased in length on both ends by half the line thickness, and now the
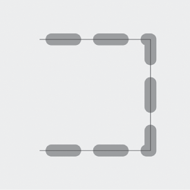
dashes actually touch. You need to fix that by increasing the gap:
<Grid Background="LightCyan">
    <Polyline Points="100 100, 380 100,
                      380 380, 100 380"
              Stroke="HotPink"
              StrokeThickness="30"
              StrokeStartLineCap="Round"

              StrokeEndLineCap="Round"
              StrokeLineJoin="Round"
              StrokeDashArray="2 2"
              StrokeDashCap="Round" />

    <Polyline Points="100 100, 380 100,
                      380 380, 100 380"
              Stroke="Black" />
</Grid>
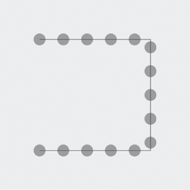
If you want to draw a dotted line with actual round dots, obviously you want to use the Round dash cap, and you want each dot to be separated by its neighbor by the dot width. The StrokeDashArray required for this job is somewhat non-intuitive. It’s a dash length of 0 and a gap length of 2:
<Grid Background="LightCyan">
    <Polyline Points="100 100, 380 100,
                      380 380, 100 380"
              Stroke="HotPink"
              StrokeThickness="30"
              StrokeStartLineCap="Round"
              StrokeEndLineCap="Round"
              StrokeLineJoin="Round"
              StrokeDashArray="0 2"
              StrokeDashCap="Round" />

    <Polyline Points="100 100, 380 100,
                      380 380, 100 380"
              Stroke="Black" />
</Grid>
You can have more than two numbers. Here’s a dot and dash configuration:
<Grid Background="LightCyan">
    <Polyline Points="100 100, 380 100,
                      380 380, 100 380"
              Stroke="HotPink"
              StrokeThickness="30"
              StrokeStartLineCap="Round"
              StrokeEndLineCap="Round"
              StrokeLineJoin="Round"
              StrokeDashArray="0 2 2 2"
              StrokeDashCap="Round" />

    <Polyline Points="100 100, 380 100,
                      380 380, 100 380"
              Stroke="Black" />
</Grid>
You don’t even need an even number of numbers:
<Grid Background="LightCyan">
    <Polyline Points="100 100, 380 100,
                      380 380, 100 380"
              Stroke="HotPink"
              StrokeThickness="30"
              StrokeStartLineCap="Round"
              StrokeEndLineCap="Round"
              StrokeLineJoin="Round"
              StrokeDashArray="1 2 3"
              StrokeDashCap="Round" />

    <Polyline Points="100 100, 380 100,
                      380 380, 100 380"
              Stroke="Black" />
</Grid>
The other dash-related property is StrokeDashOffset, and it is also relative to the thickness of the line. This property lets you start the dashes in the middle of a dash, which makes the first dash (at the upper-left corner) smaller than the rest:
<Grid Background="LightCyan">
        <Polyline Points="100 100, 380 100,
                          380 380, 100 380"
                  Stroke="HotPink"
                  StrokeThickness="30"
                  StrokeStartLineCap="Round"
                  StrokeEndLineCap="Round"
                  StrokeLineJoin="Round"
                  StrokeDashArray="2 2"
                  StrokeDashCap="Round"
                  StrokeDashOffset="1" />

        <Polyline Points="100 100, 380 100,
                          380 380, 100 380"
                  Stroke="Black" />
</Grid>
Or you can start with a gap:
<Grid Background="LightCyan">
    <Polyline Points="100 100, 380 100,
                      380 380, 100 380"
              Stroke="HotPink"
              StrokeThickness="30"
              StrokeStartLineCap="Round"
              StrokeEndLineCap="Round"
              StrokeLineJoin="Round"
              StrokeDashArray="2 2"
              StrokeDashCap="Round"
              StrokeDashOffset="3" />

    <Polyline Points="100 100, 380 100,
                      380 380, 100 380"
              Stroke="Black" />
</Grid>
You can use a dotted line around an ellipse if you want:
<Grid Background="LightCyan">
    <Ellipse Width="400" Height="400"
             HorizontalAlignment="Center"
             VerticalAlignment="Center"
             Stroke="Red"
             StrokeThickness="23.22"
             StrokeDashArray="0 1.5"
             StrokeDashCap="Round" />
</Grid>

It’s an unusual look, but you really have to experiment or do some calculations so you don’t get half a dot in there.
