Silverlight supports a type of
“mini-language” that allows you to encode an entire PathGeometry in a string. The language consists of letters (such as
M for Move, L for Line, A for Arc, and C
for Cubic Bézier)
that take the place of PathFigure and PathSegment objects. Each new PathFigure begins
with a Move command. The syntax is described in the Graphics
section of the online Silverlight documentation.
Here’s an example:
<Grid Background="LightCyan">
    <Path Stroke="Maroon"
          StrokeThickness="4"
          Data="M 160 140 L 150 50 220 103
                M 320 140 L 330 50 260 103
                M 215 230 L 40 200
                M 215 240 L 40 240
                M 215 250 L 40 280
                M 265 230 L 440 200
                M 265 240 L 440 240
                M 265 250 L 440 280
                M 240 100
                A 100 100 0 0 1 240 300
                A 100 100 0 0 1 240 100
                M 180 170
                A 40 40 0 0 1 220 170
                A 40 40 0 0 1 180 170
                M 300 170
                A 40 40 0 0 1 260 170
                A 40 40 0 0 1 300 170" />
</Grid>

The Arc is probably the
most complex syntax. It begins with the size of the ellipse, followed by
a rotation angle, and then two flags, 1 for IsLargeArc
and 1 for Clockwise, and concluding with the point. When drawing complete
circles, you’ll want to separate the circle into two halves and use two
Arc commands (or two ArcSegment
objects).
Besides using geometries for drawing you can use geometries for clipping. Here’s the famous KeyholeOnTheMoon
image:
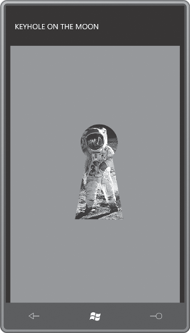
This program makes use of the Clip property of type Geometry. Clip is defined by FrameworkElement so
you can use the property to make any element or control visually
non-rectangular in shape, and the Path Markup Syntax makes it look trivial:
Example 1. Silverlight
Project: KeyholeOnTheMoon File: MainPage.xaml (excerpt)
<Grid x:Name="ContentPanel" Grid.Row="1" Margin="12,0,12,0"
      Background="{StaticResource PhoneAccentBrush}">
    <Image Source="Images/BuzzAldrinOnTheMoon.png"
           Stretch="None"
           Clip="M 120 95 L 90 265 L 220 265 L 190 95
                          A 50 50 0 1 0 120 95" />
</Grid>
|
I’ve also used Path Markup Syntax in the Analog Clock program. Here’s what it looks like:
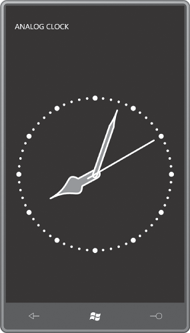
The visuals consist of five Path elements. The
curves on the hour and minute hand are Bézier splines. The tick marks
are dotted arc segments.
The XAML file defines a Style
that’s used for all five Path
elements:
Example 2. Silverlight
Project: AnalogClock File: MainPage.xaml (excerpt)
<phone:PhoneApplicationPage.Resources>
    <Style x:Key="pathStyle"
           TargetType="Path">
        <Setter Property="Fill" Value="{StaticResource PhoneAccentColor}" />
        <Setter Property="Stroke" Value="{StaticResource PhoneForegroundColor}" />
        <Setter Property="StrokeThickness" Value="2" />
        <Setter Property="StrokeStartLineCap" Value="Round" />
        <Setter Property="StrokeEndLineCap" Value="Round" />
        <Setter Property="StrokeLineJoin" Value="Round" />
        <Setter Property="StrokeDashCap" Value="Round" />
    </Style>
</phone:PhoneApplicationPage.Resources>
|
In an attempt to keep the graphics
simple, I devised an arbitrary coordinate
system. The clock graphics are drawn as
if the width and height of the clock were 200 pixels, and the center
were the point (0, 0). The clock graphics are thus bounded by X
coordinates of –100 on the left and 100 on the right, and Y coordinates
of –100 on the top and 100 on the bottom.
These arbitrary
coordinates of the clock
are in part defined by the explicit Width
and Height
settings of this nested Grid:
Example 3. Silverlight
Project: AnalogClock File: MainPage.xaml (excerpt)
<Grid x:Name="ContentPanel" Grid.Row="1" Margin="12,0,12,0"
      SizeChanged="OnContentPanelSizeChanged">

    <!-- Draw clock on Grid with center at (0, 0) -->
    <Grid Width="200" Height="200">
        <Grid.RenderTransform>
            <TransformGroup>
                <ScaleTransform x:Name="scaleClock" />
                <TranslateTransform X="100" Y="100" />
            </TransformGroup>
        </Grid.RenderTransform>

        . . .

    </Grid>
</Grid>
|
The TranslateTransform
shifts the whole Grid to the right and down. The upper-left coordinate of (–100,
–100), for example, becomes (0, 0), and a coordinate of (100, 100)
becomes (200, 200).
Notice the SizeChanged event handler set on the normal content grid. The
code portion uses the actual size of the content area to set the ScaleTransform
applied to the nested Grid. That scales the 200-pixel dimension to the
actual size:
Example 4. Silverlight
Project: AnalogClock File: MainPage.xaml.cs (excerpt)
void OnContentPanelSizeChanged(object sender, SizeChangedEventArgs args)
{
    double scale = Math.Min(args.NewSize.Width, args.NewSize.Height) / 200;
    scaleClock.ScaleX = scale;
    scaleClock.ScaleY = scale;
}
|
Here are the five paths:
Example 5. Silverlight
Project: AnalogClock File: MainPage.xaml (excerpt)
<!-- Tick marks (small and large). -->
<Path Data="M 0 -90 A 90 90 0 1 1 0 90
                    A 90 90 0 1 1 0 -90"
      Style="{StaticResource pathStyle}"
      Fill="{x:Null}"
      StrokeDashArray="0 3.14159"
      StrokeThickness="3" />

<Path Data="M 0 -90 A 90 90 0 1 1 0 90
                    A 90 90 0 1 1 0 -90"
      Style="{StaticResource pathStyle}"
      Fill="{x:Null}"
      StrokeDashArray="0 7.854"
      StrokeThickness="6" />

<!-- Hour hand pointing up. -->
<Path Data="M 0 -60 C 0 -30, 20 -30, 5 -20 L 5 0
                    C 5 7.5, -5 7.5, -5 0 L -5 -20
                    C -20 -30, 0 -30 0 -60"
      Style="{StaticResource pathStyle}">
    <Path.RenderTransform>
        <RotateTransform x:Name="rotateHour" />
    </Path.RenderTransform>
</Path>

<!-- Minute hand pointing up. -->
<Path Data="M 0 -80 C 0 -75, 0 -70, 2.5 -60 L 2.5 0
                    C 2.5 5, -2.5 5, -2.5 0 L -2.5 -60
                    C 0 -70, 0 -75, 0 -80"
      Style="{StaticResource pathStyle}">
    <Path.RenderTransform>
        <RotateTransform x:Name="rotateMinute"  />
    </Path.RenderTransform>
</Path>

<!-- Second hand pointing up. -->
<Path Data="M 0 10 L 0 -80"
      Style="{StaticResource pathStyle}">
    <Path.RenderTransform>
        <RotateTransform x:Name="rotateSecond"  />
    </Path.RenderTransform>
</Path>
|
The StrokeDashArray settings on the first two Path elements were carefully calculated to produce
the pattern of 1-second and 5-second tick marks around the face of the clock. The other three Path elements have RotateTransform
objects set to their RenderTransform
properties. These RotateTransforms are
reset every second from the code-behind file:
Example 6. Silverlight
Project: AnalogClock File: MainPage.xaml.cs (excerpt)
public partial class MainPage : PhoneApplicationPage
{
    public MainPage()
    {
        InitializeComponent();

        DispatcherTimer tmr = new DispatcherTimer();
        tmr.Interval = TimeSpan.FromSeconds(1);
        tmr.Tick += new EventHandler(OnTimerTick);
        tmr.Start();
    }

    void OnTimerTick(object sender, EventArgs args)
    {
        DateTime dt = DateTime.Now;

        rotateSecond.Angle = 6 * dt.Second;
        rotateMinute.Angle = 6 * dt.Minute + rotateSecond.Angle / 60;
        rotateHour.Angle = 30 * (dt.Hour % 12) + rotateMinute.Angle / 12;
    }
    . . .
}
|
