Developers can use the Visual Studio
integrated development environment (IDE) to create Dynamics AX
Reporting Services reports. In this section, we cover the tools and
processes that developers and administrators can use to develop
Reporting Services production reports.
Dynamics AX Reporting Development Tools
Dynamics
AX 2009 includes development tools that enable developers to create
Dynamics AX Reporting Services production reports in Visual Studio
2008. The new development tools have been created from the ground up to
be fully integrated with Dynamics AX. These tools provide report
designers the benefit of working within the familiar Visual Studio 2008
IDE and the ability to leverage rich reporting features from Reporting
Services.
The Dynamics AX reporting
development tools comprise a modeling tool that allows report designers
to visualize the report elements as they are developing a report. The
report is fully customizable within Visual Studio. The reports created
are in the Report Definition Language (RDL) format specified by
Reporting Services. By utilizing this widely adopted format, report
designers can leverage the many features (e.g., charting,
interactivity, and access to multiple data sources, as mentioned
earlier) that make Reporting Services a popular choice for production
reports. These reports can then be deployed, stored, managed, and
processed on the report server using the Reporting Services technology.
Integration with Dynamics AX
The
Dynamics AX reporting tools include a new Visual Studio project type
called “Dynamics AX Reporting Project.” This project type allows
developers to create Reporting Services reports that bind to data in
Dynamics AX.
A Dynamics AX Reporting Project has the following features:
Allows a report to retrieve from AOS via .NET Business Connector
Defines report parameters
Uses localized strings for report elements
Edits and saves reports in the AOT
Deploys reports to the report server
Report Development Life Cycle
Figure 1 is a high-level view of the report development process.
Figure 1
illustrates the primary tasks performed during the two major stages of
the report life cycle. At design time, the report developer designs the
report with the Dynamics AX reporting tools in Visual Studio 2008,
performs the desired customization, and previews the report design.
When the report is ready, the developer deploys the report by using the
built-in report deployment feature in Visual Studio or the Dynamics AX
2009 Reports Deployment tool. After the reports are deployed, they are
ready to be viewed in the Dynamics AX client and Enterprise Portal.
Administrators can configure menu items, and Web parts open the
deployed reports.
Reporting Tools Model Elements
In
the following sections, we introduce several important model elements
of reporting tools. If you understand these model elements and the way
they work, you can develop reports quickly and easily. Figure 2 shows a typical Report Model Editor as it appears when you first create a report project.
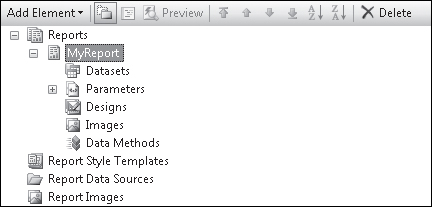
A
few collection objects, such Reports and Report Style Templates, are at
the root level. Each collection object has zero or more child objects.
Reports
Each
Dynamics AX Reporting Project contains one or more report models. Each
model has exactly one root Reports element. This element contains all
the reports in the current model.
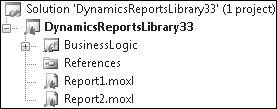
Every model corresponds to a .moxl file displayed in Solution Explorer. Figure 3 shows a report project in Visual Studio 2008 Solution Explorer.
Report Designs
A
report design is a particular layout for a report. A single report can
have multiple designs that form the basic blueprints for the rendered
reports. Report developers have the option of creating auto designs or
precision designs.
Auto designs
An auto design is automatically generated based on the information
specified in the report model. You create auto designs in Model Editor.
The auto design functionality provides an efficient way to create the
most common types of reports, such as a customer list or a list of
inventory items.
Precision designs
Precision designs are typically used when a report requires a precise
layout, such as invoices or bank checks. When creating a precision
design, you can manually drag fields onto a report, placing them
exactly where you want them.
Auto design layout
An
auto design follows a particular layout. It has a header, a body
containing one or more data regions, and a footer, as shown in Figure 4.
You
can control the content that is displayed in each area within an auto
design. For example, you can include a report title and the date in the
header and display the page number in the footer, or you can leave the
header and footer blank.
The data
regions that display in an auto design depend on the data sets you
create when you define the data for the report in Model Editor. When
you define a data set, you can specify the type of data region that is
used to render the data whenever that data set is used in an auto
design. Data can be displayed in table, list, matrix, or chart format.
One way to create an auto design is simply to drag a data set onto the Designs node for the auto design in the model.
Precision design layout
A precision design is free-form, and its format can vary depending on the layout required for particular reports.
Structure of a Dynamics AX Reporting Project
Figure 5 shows the hierarchical relationship among project, model, reports, and designs.
Report
projects are Microsoft Visual C# or Microsoft Visual Basic container
projects in which one or more report models can be stored as .moxl
files. Each report model, visualized in Model Editor, can include
multiple reports, and each report can contain multiple designs,
regardless of whether they are auto designs or precision designs.
Report Data Sources
Data
sources are crucial to the development of useful production reports.
The very purpose of a production report is to retrieve data from its
source and to display the data in a fashion that is easy for users to
consume. A major benefit of the Dynamics AX Visual Studio reporting
tools is the ability to connect to a variety of different types of
report data sources. Even better, a report can display data from
multiple data sources. Table 1 lists the data source types supported by the Dynamics AX Visual Studio reporting tools.
Table 1. Data Source Types Supported by Visual Studio Reporting Tools
| Data Source Type | Data Content |
|---|
| Dynamics AX | Queries that are defined in the AOT
Data methods that are defined within a reporting project in Visual Studio 2008 |
| SQL | T-SQL query
Stored procedure |
| OLAP | MDX query |
Dynamics AX
is a predefined data source that allows you to connect to OLTP data
stored in Dynamics AX. It supports both SQL Server and Oracle
databases. It also allows you to bind data sets to data methods that
contain your custom business logic that returns a DataTable.
The report developer needs to define the SQL or OLAP data source type. You need to create a new data source under the Report DataSources node, specify the Connection String
property, and select the desired data provider type (SQL or OLAP). By
doing so, you give your reports the ability to connect directly to the
data source instead of having to go through the AOS, which is the
process with the Dynamics AX data source type.
Data Methods
You
use a data method to write the code for your report’s business logic.
You can add a data method by creating a new subnode under Data Methods
in the Report Model. After you have done so, you can bring up the code
editing window by double-clicking the new data method node. What you
see is the standard C# or Visual Basic code editing environment that
every .NET developer should be familiar with.
You
can find all the Visual Studio features you’re familiar with, such as
IntelliSense and syntax highlighting. You can also reference any of the
.NET libraries to increase your productivity and get creative with your
business logic. By adding references in the project, you also have
access to a wider variety of helper classes and libraries that you’ve
created.
