Running a Data Collector Set in Performance Monitor
The easiest way to run a Data Collector Set is to
right-click on it and choose Start. When you are done capturing,
right-click again and choose Stop. However, this is probably not the
most effective way to execute your Data Collector Sets. A more effective
approach is to set up a schedule for data collection.
During Data Collector Set creation, you can configure
the schedule by selecting Open Properties for this Data Collector Set
at the end of the Create New Data Collector Set Wizard. After a Data
Collector Set is created, you can access the schedule options by
right-clicking the Data Collector Set name in the Microsoft Management
Console (MMC) navigation pane and selecting Properties. When the
Properties dialog is displayed, click the Schedule tab to specify the
schedule when you want the Data Collector to run. You can specify the
start date, time, or day for data collection. If you do not want to
collect new data after a certain date, select Expiration Date and choose
a date from the calendar. You can create multiple schedules for a
single Data Collector Set.
The Data Collector runs continuously unless you
specify a Stop condition for a Data Collector Set. The Stop condition
can be set in the Stop Condition tab. To stop collecting data after a
period of time, select Overall Duration and choose the quantity and
units. On the Stop Condition tab, you can also specify limits to segment
data collection into separate logs. Select the Restart the Data
Collector Set at Limits option to continue running the Data Collector
after the limit is reached. You can select Duration to configure a time
period for data collection to write to a single log file, or select
Maximum Size to restart the Data Collector Set or to stop collecting
data when the log file reaches a specific size. If you select both
limits, data collection stops or restarts when the first limit is
reached.
Tip
If you are running a Data Collector continuously, you
should set a limit so that the Data Collector breaks the log file into
multiple segments. In addition to preventing the file from becoming
exceedingly large, breaking up the log file also enables you to view the
log file segments prior to the current one while the Data Collector Set
is running. Unfortunately, you cannot directly open the currently
active log file for a Data Collector Set to view the live data
collection. However, if you have a previous report available, you can
open the report in the Performance Monitor window. When this report is
open, click the View Current Activity button (or press Ctrl+T) and you
can view the current activity in real-time as it’s being captured.
Viewing Data Collector Set Results in Performance Monitor
To view a Data Collector Set report in Windows
Performance Monitor, expand Reports and click User Defined or System.
Then expand the Data Collector Set that you want to view as a report.
Simply click the report that you want to view from the list of available
reports. The report opens in the console pane.
If you want to open one or
more log files in Performance Monitor (perhaps you have a set of log
files copied from another server), in the Windows Performance Monitor
navigation pane, expand Monitoring Tools and click Performance Monitor.
In the console pane toolbar, click the Add Log Data button (or press
Ctrl+L). The Performance Monitor Properties page opens with the Source
tab active (see Figure 25). In the Data Source section, follow these steps:
1. | Select Log Files and click Add.
|
2. | Browse to the log file you want to view and click Open.
|
3. | To add multiple log files to the Performance Monitor view, click Add again.
|
4. | Click Time Range to see times included in the log or logs you selected.
|
5. | When you are finished selecting log files, click OK.
|
6. | Right-click
in the Performance Monitor display and click Add Counters to select the
counters you want to display in Performance Monitor. Only the counters
included in the log file or files you selected in step 4 are made
available.
|
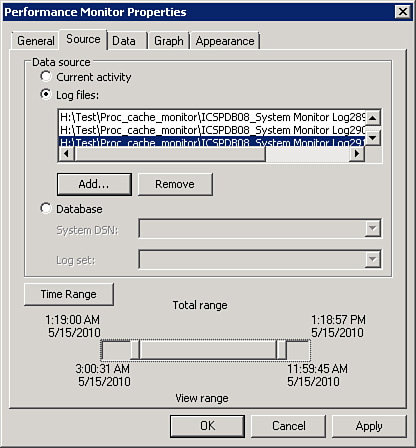
For a single log file, you can move the beginning and
ending time sliders to view only a portion of the log file in
Performance Monitor.
For multiple log files, you can move the beginning
and ending time sliders to choose the time period (from all the selected
log files) to view in Performance Monitor. If a log has data from the
time period you select, it is available in the display.
Why Use Performance Monitor?
You might be asking, “With all the new performance
monitoring tools provided with SQL Server, is there a need to continue
to use Performance Monitor?”
Even
though many of the performance counters and relevant information are
now available in the SQL Server Data Collector, as mentioned previously,
the Data Collector does incur some overhead on SQL Server. Performance
Monitor, on the other hand, incurs significantly less impact on SQL
Server performance.
In addition, the SQL Server Data Collector currently
doesn’t have a built-in alerting capability. As mentioned previously,
you can set up performance counter alerts in Performance Monitor. In
addition, Performance Monitor enables you to monitor more than what is
provided with SQL Server Data Collector, including all aspects of the
operating system as well as other applications.
One other feature that’s very useful with Performance
Monitor logs is the capability to import performance counter logs into
SQL Server Profiler.
SQL Server Performance Counters
For each SQL Server instance installed, Performance
Monitor has a number of SQL Server–specific performance objects added to
it, each with a number of associated counters. Each SQL Server instance
has its own set of monitoring objects because you certainly wouldn’t
want to mix monitoring values across multiple instances. Performance
counters for named instances use the naming convention MSSQL$ followed by the instance name (for example, MSSQL$SQL2008DEV:General Statistics).
Performance counters for the default instance of SQL Server use the
naming convention of SQLSERVER followed by the counter name (for
example, SQLServer:General Statistics).
Table 1 provides a list of the SQL Server performance counters available for SQL Server 2008
Table 1. SQL Server Performance Objects
| Performance Object | Description |
|---|
| SQLServer:Access Methods | Information
on searches and allocations of SQL Server database objects (for
example, the number of index searches or number of pages allocated to
indexes and data). |
| SQLServer:Backup Device | Information about backup devices, such as the throughput of the backup device. |
| SQLServer:Buffer Manager | Information about the memory buffers used by SQL Server. |
| SQLServer:Buffer Partition | Information about buffer free page accesses. |
| SQLServer:CLR | Information about common language runtime (CLR) |
| SQLServer:Cursor Manager by Type
SQLServer:Cursor Manager Total | Information about cursors. |
| SQLServer:Database Mirroring | Information about database mirroring. |
| SQLServer:Databases | Database-specific
information such as the amount of free log space available or the
number of active transactions in the database. |
| SQL Server:Deprecated Features | Information on the number of times deprecated features are used. |
| SQLServer:Exec Statistics | Execution statistics information. |
| SQLServer:General Statistics | General server-wide activity, such as the number of logins per second. |
| SQLServer:Latches | Information about the latches on internal resources, such as database pages. |
| SQLServer:Locks | Information about the individual lock requests made by SQL Server, such as lock timeouts and deadlocks. |
| SQLServer:Memory Manager | Information about SQL Server memory usage, such as the total number of lock structures currently allocated. |
| SQLServer:Plan Cache | Information about the SQL Server cache used to store objects such as stored procedures, triggers, and query plans. |
| SQLServer: Resource Pool Stats | Information about Resource Governor resource pool statistics. |
| SQLServer:SQL Errors | Information about SQL Server errors. |
| SQLServer:SQL Statistics | Query statistics, such as the number of batches of T-SQL statements received by SQL Server. |
| SQLServer:Transactions | Transaction statistics, such as the overall number of transactions and the number of snapshot transactions. |
| SQLServer:User Settable | Custom counters that can be a custom stored procedure or any T-SQL statement that returns a value to be monitored. |
| SQLServer: Wait Statistics | Information about waits. |
| SQLAgent:Alerts | Information about SQL Server Agent alerts. |
| SQLAgent:Jobs | Information about SQL Server Agent jobs. |
| SQLAgent:JobSteps | Information about SQL Server Agent job steps. |
| SQLAgent:Statistics | General information about SQL Server Agent. |
| SQLServer:Replication Agents
SQLServer:Replication Snapshot
SQLServer:Replication Logreader
SQLServer:Replication Dist.
SQLServer:Replication Merge | Information about replication agent activity. |
User-Defined Counters
You
can extend the range of information that Performance Monitor displays
by creating up to 10 of your own counters. These user-defined counters
appear under the SQLServer:User Settable:Query object, which
contains the 10 counters as instances, starting with User Counter 1. You
define your own counters by calling stored procedures with the names sp_user_counter1 through sp_user_counter10, which are located in the master database.
These counters work differently than they did under
previous versions of SQL Server and require you to call the stored
procedures to update the information they return to Performance Monitor.
To make any real use of these stored procedures, you now need to call
them within a loop or as part of a job that is scheduled on some
recurring basis.
Using these counters allows you to monitor any
information you want, whether it is system, database, or even object
specific. The only restriction is that the stored procedure can take
only a single integer value argument.
The following sample user-defined counter procedure
sets the counter value to the average connection time for all user
connections. Processes that have a session_id less than 50 are internal system processes (checkpoint, Lazy Writer, and so on):
DECLARE @value INT

SELECT @value = AVG( DATEDIFF( mi, login_time, GETDATE()))
FROM sys.dm_exec_sessions
WHERE session_id > 50

EXEC sp_user_counter1 @value
You
could further extend this information by creating additional user
procedures for returning the minimum and maximum times connected, as
well as database usage. Your only limitation is that you can monitor
only a maximum of 10 pieces of information at one time.
Accessing Performance Counters via T-SQL
Most of the SQL Server–oriented performance counter
values can also be seen at any point in time via the system catalog view
named sys.sysperfinfo:
SELECT * from sys.sysperfinfo
This view shows the performance object name, counter name, and current counter value as of the time the system view is executed.
You should keep in mind that many of the
performance counters are accumulation counters, and you have to run them
at intervals and determine the difference (change) from one interval to
the next. Others are current values of aspects such as transaction
rates, memory usage, and hit ratios.
