Using the Networking Tab in Task Manager
Sometimes, you
just want to get quick information about what’s going on. If you wanted a
phone number for a local pizzeria, you could look in the phone book and
find the one you wanted, or you could get on the Internet and do a
search for pizzerias within 5 miles, or you could ask a friend. Or you
could simply dial 411 and get the information immediately. The operator
usually even connects your call for another 50 cents. The beauty here is
in the speed of getting what you want.
If your users report
that a specific server is not responding to their requests
appropriately, you should take immediate steps to diagnose the problem.
The problem might be transient;
that is, it might go away on its own. For instance, a 20-GB file might
be transferring to or from the server, and hence, other requests might
not be getting through. Other network performance problems are intermittent:
they come and go with or without a pattern. These problems can occur
after someone sets up a job to communicate with a server on a schedule
or changes the normal routine to something abnormal.
But no matter what the
problem is, you will probably want to resolve it right away. That’s what
Windows Server 2003 Task Manager enables you to do.
Task Manager is a great
tool for inspecting many areas of your server all at once. One area it
can help you learn about your system is, in fact, networking
performance. Although Task Manager might be less powerful than other
tools , it is quite simple to access and can
tell you a lot about the activities on your network.
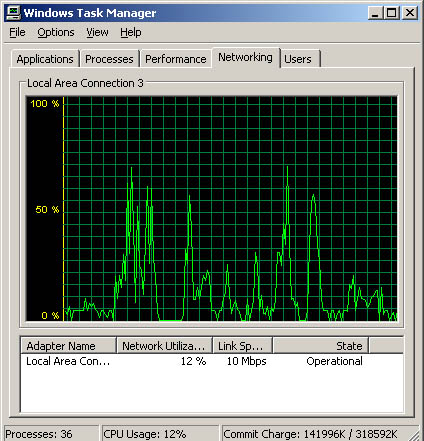
To access Task Manager, you press Ctl+Alt+Del and click the Task Manager button. Then select the Networking tab, as shown in Figure 1.

The Networking tab
provides an overview of the use on your network card. The scale on the
left is the percentage used, and it automatically changes scale
depending on how much the link is used. You can also determine other
miscellaneous data—such as whether the link is operational or
unplugged—by looking at the State column. And in the Link Speed column,
you can see what speed the link is.
Choosing What to See Within the History
If you are receiving
reports that the server is not responding fast enough to reads or
writes, you might want to isolate the view of the network traffic.
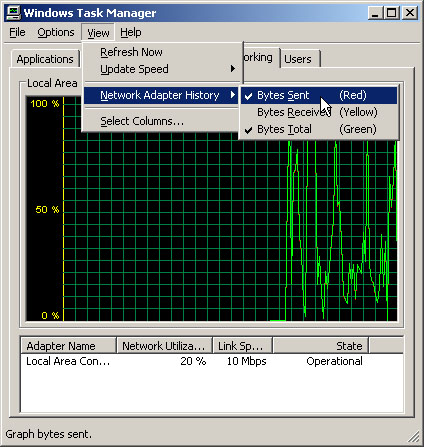
Indeed, you can choose to show and highlight the total traffic (the
default) or choose to show and highlight the bytes sent or bytes
received, as shown in Figure 2.

Filtering
allows you to ignore the other “direction” of the network flow. That
is, if you are troubleshooting a server that is not responding quickly
to writes, you can temporarily ignore the bytes sent. Conversely, if you
are troubleshooting a server that is not responding quickly to reads,
you can temporarily ignore the bytes received.
Choosing Columns
As you saw in Figure 1,
you can obtain an overview of some important state data, such as link
speed. However, Network Monitor can also be a useful tool to determine
which types of traffic are coming across the interface. Your view of
what’s going on is greatly enhanced by means of a network counter:
an exposed piece of information, sometimes called a data point, that
you can access to see the current status. If you determine the value of
an available data point over time, you are sampling the data.
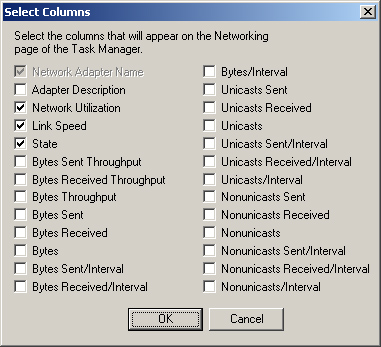
You can choose to add more
counters in the overview by opening the View menu and selecting Select
Columns. Then you will expose all the available counters, as shown in Figure 3.

There are 26 counters for you to examine. However, not every counter will be important in your troubleshooting. Table 1 shows some of the most useful counters for troubleshooting network performance.
Table 1. Helpful Counters
| Property | Description |
|---|
| Network Adapter Name | The
name of the network adapter. This check box is always selected. If you
have multiple network adapters, you will see multiple listings. |
| Link Speed | The
speed of the network interface. If you suspect a bottleneck, verify
that this number is the maximum speed of the network. Sometimes, the
network card receives a signal from the router to fall back to a slower
speed (typically 10 Mbps from 100 Mbps). |
| Bytes/Interval | The
rate at which bytes are sent and received on the network adapter. You
can best judge this counter after gaining a baseline of your operations
when your network is running smoothly. |
| Unicasts/Interval | The
number of unicast datagrams received during this interval. If this
counter has data, you are likely dealing with real data and not
broadcast traffic, which might be seen in the next counter,
Nonunicasts/Interval. |
| Nonunicasts/Interval | The
number of broadcast and multicast datagrams received during this
interval. If this counter has data, your interface might be dealing with
background or broadcast traffic. You might have problems on your
network that aren’t specifically related to this server if this counter
is high. |