Logo
programming4us
programming4us
programming4us
programming4us
Home
programming4us
XP
programming4us
Windows Vista
programming4us
Windows 7
programming4us
Windows Azure
programming4us
Windows Server
programming4us
Windows Phone
 
programming4us
Windows 7

Microsoft Visio 2010 : Introducing Data Graphics (part 1) - What Is a Data Graphic?

- Free product key for windows 10
- Free Product Key for Microsoft office 365
- Malwarebytes Premium 3.7.1 Serial Keys (LifeTime) 2019
3/31/2014 4:06:37 AM

If you have Visio 2010 Pro or Premium, you have another fantastic option for working with Shape Data: Data Graphics. Data Graphics are visual adornments that bring Shape Data out in the open by making it visible and visual. You apply Data Graphics to shapes so that you can visualize the data behind them without having to modify the shapes.

What Is a Data Graphic?

Figure 1 shows a single Light Bulb shape with a single Data Graphic applied to it. Although several adornments surround the shape, they are all part of a single Data Graphic. Each of the pieces is known as a Data Graphic item. A single Data Graphic can be composed of many Data Graphic items, and the items can be located at different positions around the shape. So a Data Graphic is a predefined set of visualizations that bring Shape Data to the surface.

Figure 1. A Light Bulb shape with a Data Graphic applied. An icon tells you the Bulb Type, the bar’s length shows you the Power rating, as does the circle’s fill color. Finally, a text callout shows the Model information.


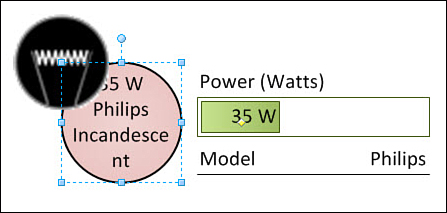
As Figure 1 hints, the four types of Data Graphic items are as follows:

  • Text callout

  • Data bar

  • Icon set

  • Color by value

The Data Graphic applied to the Light Bulb in Figure 1 uses all four of them. Color by value isn’t really a graphical adornment. It changes the hue or shade of a shape, depending on the value of a Shape Data field. Color by value is similar to what you might know as a “heat map.”

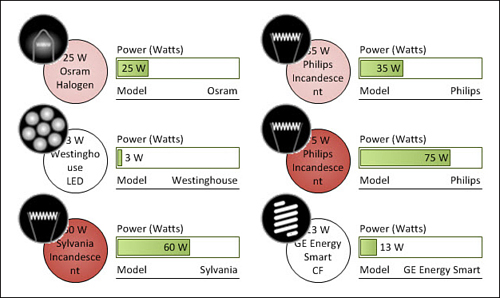
Figure 1 is nice, but Data Graphics make much more sense if you see them applied to numerous shapes, with differing data. Figure 2 shows several Light Bulb shapes, all with the same Data Graphic applied to them. Note how the different parts change for each bulb (and, therefore, each set of data).

Figure 2. Several Light Bulb shapes with the same Data Graphic applied. Icons change, bars grow longer and shorter, color intensity varies, and text displays the model. It’s easy to see the bulbs that use more energy by looking for darker shades or longer bars.

You can start to imagine the possibilities: opening a network diagram every day, refreshing the data, and noting which servers display an alert icon when there’s a problem. Or perhaps you might want to analyze a process flow by color-coding processes according to duration or cost. Those over a threshold could, for example, turn red, making them instantly identifiable.

Other -----------------
- Microsoft Visio 2010 : Linking External Data to Shapes (part 6) - Using Link Data - Linking Data to Shapes Using Link Data
- Microsoft Visio 2010 : Linking External Data to Shapes (part 5) - Using Link Data - Preparing a Master for Link Data , Importing Data for Link Data
- Microsoft Visio 2010 : Linking External Data to Shapes (part 4) - Using the Database Wizard - Taking the Data-Linked Light Bulb Shape for a Spin
- Microsoft Visio 2010 : Linking External Data to Shapes (part 3) - Using the Database Wizard - Setting Up the Excel File as a Data Source
- Microsoft Visio 2010 : Linking External Data to Shapes (part 2) - Preparing the Light Bulb Shape for Data Linking
- Microsoft Visio 2010 : Linking External Data to Shapes (part 1) - Preparing the Data
- Microsoft Visio 2010 : Working with Data - Creating Reports (part 3) - Using Reports with Other Documents
- Microsoft Visio 2010 : Working with Data - Creating Reports (part 2) - Grouping and Totaling Items in a Report
- Microsoft Visio 2010 : Working with Data - Creating Reports (part 1) - Introducing the Report Definition Wizard
 
 
Top 10
- Microsoft Visio 2013 : Adding Structure to Your Diagrams - Finding containers and lists in Visio (part 2) - Wireframes,Legends
- Microsoft Visio 2013 : Adding Structure to Your Diagrams - Finding containers and lists in Visio (part 1) - Swimlanes
- Microsoft Visio 2013 : Adding Structure to Your Diagrams - Formatting and sizing lists
- Microsoft Visio 2013 : Adding Structure to Your Diagrams - Adding shapes to lists
- Microsoft Visio 2013 : Adding Structure to Your Diagrams - Sizing containers
- Microsoft Access 2010 : Control Properties and Why to Use Them (part 3) - The Other Properties of a Control
- Microsoft Access 2010 : Control Properties and Why to Use Them (part 2) - The Data Properties of a Control
- Microsoft Access 2010 : Control Properties and Why to Use Them (part 1) - The Format Properties of a Control
- Microsoft Access 2010 : Form Properties and Why Should You Use Them - Working with the Properties Window
- Microsoft Visio 2013 : Using the Organization Chart Wizard with new data
 
programming4us
Windows Vista
programming4us
Windows 7
programming4us
Windows Azure
programming4us
Windows Server