If you’re using EllipseGeometry and you don’t want the axes of the ellipse to be aligned on the horizontal and vertical, you can apply a RotateTransform to it. And you have a choice. Because Path derives from UIElement, you can set this RotateTransform to the RenderTransform property of the Path:
<Grid Background="LightCyan">
  <Path Stroke="Maroon"
        StrokeThickness="8"
        Fill="Green">
    <Path.Data>
      <EllipseGeometry Center="250 150"
                       RadiusX="150"
                       RadiusY="100" />
    </Path.Data>
    <Path.RenderTransform>
      <RotateTransform Angle="45"
                       CenterX="250"
                       CenterY="150" />
    </Path.RenderTransform>
  </Path>
</Grid>
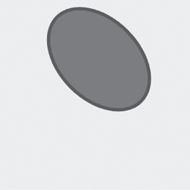
Notice that the CenterX and CenterY properties of RotateTransform are set to the same values as the Center point of the EllipseGeometry itself so that the ellipse is rotated around its center. When working with Path and Geometry objects, it’s usually easier to specify actual transform centers rather than to use RenderTransformOrigin. Normally you set RenderTransformOrigin to relative coordinates, for example (0.5, 0.5) to specify the center, but look what happens when you try that in this case:
<Grid Background="LightCyan">
  <Path Stroke="Maroon"
        StrokeThickness="8"
        Fill="Green"
        RenderTransformOrigin="0.5 0.5">
    <Path.Data>
      <EllipseGeometry Center="250 150"
                       RadiusX="150"
                       RadiusY="100" />
    </Path.Data>

    <Path.RenderTransform>
      <RotateTransform Angle="45" />
    </Path.RenderTransform>
  </Path>
</Grid>
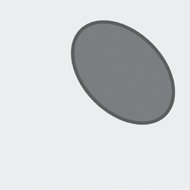
The problem here is that the Path element is large enough to accommodate an EllipseGeometry with a center at (250, 150) and a RadiusX of 150 and a RadiusY of 100, so the Path element must be at least about 400 pixels wide and 250 pixels tall. (It’s actually a little larger due to the non-zero StrokeThickness.) The center of this Path is approximately the point (200, 125). In addition,, like other elements, the Path has default HorizontalAlignment and VerticalAlignment properties of Stretch, so it’s really filling its container, in this case 480 pixels square, so the rotation is actually around the point (240, 240).
It’s also possible to apply a transform to the Geometry object itself:
<Grid Background="LightCyan">
  <Path Stroke="Maroon"
        StrokeThickness="8"
        Fill="Green">
    <Path.Data>
      <EllipseGeometry Center="250 150"
                       RadiusX="150"
                       RadiusY="100">
        <EllipseGeometry.Transform>
          <RotateTransform Angle="45"
                           CenterX="250"
                           CenterY="150" />
        </EllipseGeometry.Transform>
      </EllipseGeometry>
    </Path.Data>
  </Path>
</Grid>

This appears to be exactly the same as the earlier example with the explicit CenterX and CenterY settings on the RotateTransform, but transforms can have rather different results depending whether they’re applied to the RenderTransform property of the Path element or to the Geometry object.
The RenderTransform property has no effect on how the element is perceived in the layout system, but the Transform property of the Geometry affects the perceived dimensions. To see this difference, enclose a Path with an EllipseGeometry in a centered Border:
<Grid Background="LightCyan">
  <Border BorderBrush="Red"
          BorderThickness="3"
          HorizontalAlignment="Center"
          VerticalAlignment="Center">
    <Path Stroke="Maroon"
          StrokeThickness="8"
          Fill="Green">
      <Path.Data>
        <EllipseGeometry Center="150 50"
                         RadiusX="150"
                         RadiusY="50" />
      </Path.Data>
    </Path>
  </Border>
</Grid>
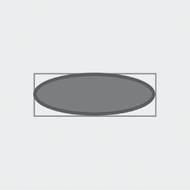
I deliberately set the Center of the EllipseGeometry to the same two values as RadiusX and RadiusY so the Path doesn’t occupy any more space than that necessary to render the ellipse.
Now set the RenderTransform of the Path for rotation:
<Grid Background="LightCyan">
  <Border BorderBrush="Red"
          BorderThickness="3"
          HorizontalAlignment="Center"
          VerticalAlignment="Center">
    <Path Stroke="Maroon"
          StrokeThickness="8"
          Fill="Green">
      <Path.Data>
        <EllipseGeometry Center="150 50"
                         RadiusX="150"
                         RadiusY="50" />
      </Path.Data>
      <Path.RenderTransform>
        <RotateTransform Angle="90"
                         CenterX="150"
                         CenterY="50" />
      </Path.RenderTransform>
    </Path>
  </Border>
</Grid>
The RenderTransform does not affect how an element is perceived in the layout system. The Border is still sizing itself based on the unrotated Path. Applying the transform to the EllipseGeometry produces quite a different result:
<Grid Background="LightCyan">
  <Border BorderBrush="Red"
          BorderThickness="3"
          HorizontalAlignment="Center"
          VerticalAlignment="Center">
    <Path Stroke="Maroon"
          StrokeThickness="8"
          Fill="Green">
      <Path.Data>
        <EllipseGeometry Center="150 50"
                         RadiusX="150"
                         RadiusY="50">
          <EllipseGeometry.Transform>
            <RotateTransform Angle="90"
                             CenterX="150"
                             CenterY="50" />
          </EllipseGeometry.Transform>
        </EllipseGeometry>
      </Path.Data>
    </Path>
  </Border>
</Grid>
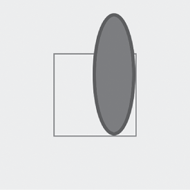
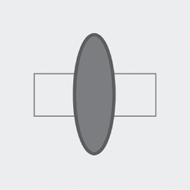
Well, that doesn’t look right, either! What happened?
The EllipseGeometry
defines an ellipse with a bounding box with an upper-left corner at the
point (0, 0) and the lower-right corner at (300, 100). That’s being
rotated 90° around the point (150, 50). The bounding box of the rotated
ellipse has an upper-left corner of (100, –100) and a lower-right corner
of (200, 200). The Border is 200 pixels square to accommodate that lower-right corner, but the negative part sticks out of the top of the Border.
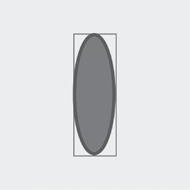
To make it work “correctly,” the center of rotation needs to be set to the point (50, 50):
<Grid Background="LightCyan">
  <Border BorderBrush="Red"
          BorderThickness="3"
          HorizontalAlignment="Center"
          VerticalAlignment="Center">
    <Path Stroke="Maroon"
          StrokeThickness="8"
          Fill="Green">
      <Path.Data>
        <EllipseGeometry Center="150 50"
                         RadiusX="150"
                         RadiusY="50">
          <EllipseGeometry.Transform>
            <RotateTransform Angle="90"
                             CenterX="50"
                             CenterY="50" />
          </EllipseGeometry.Transform>
        </EllipseGeometry>
      </Path.Data>
    </Path>
  </Border>
</Grid>
Another difference between the RenderTransform property of Path and the Transform property of Geometry is revealed when you use ScaleTransform. Let’s begin with a little rectangle aligned at the left edge:
<Grid Background="LightCyan">
  <Path Stroke="Maroon"
          StrokeThickness="4"
          Fill="Green">
    <Path.Data>
      <RectangleGeometry
          Rect="2 220 40 40" />
    </Path.Data>
  </Path>
</Grid>

I’ve actually positioned the RectangleGeometry at the point (2, 220) so the StrokeThickness of the Path doesn’t cause part of the rendered object to appear outside its confines.
Now apply a ScaleTransform to the RectangleGeometry to increase the width by a factor of 10:
<Grid Background="LightCyan">
  <Path Stroke="Maroon"
        StrokeThickness="4"
        Fill="Green">
    <Path.Data>
      <RectangleGeometry
          Rect="2 220 40 40">
        <RectangleGeometry.Transform>
          <ScaleTransform ScaleX="10" />
        </RectangleGeometry.Transform>
      </RectangleGeometry>
    </Path.Data>
  </Path>
</Grid>

The entire figure is 10 times wider, and the RectangleGeometry is now aligned at the point (20, 220). But something quite different happens when you apply the transform to the Path element:
<Grid Background="LightCyan">
  <Path Stroke="Maroon"
        StrokeThickness="4"
        Fill="Green">
    <Path.Data>
      <RectangleGeometry
          Rect="2 220 40 40" />
    </Path.Data>
    <Path.RenderTransform>
      <ScaleTransform ScaleX="10" />
    </Path.RenderTransform>
  </Path>
</Grid>

Now the thickness of the stroke at the left and right has also increased by a factor of 10!
