In this section, we identify the key
components of the Reporting Services reporting framework and describe
their functions. We also show how data flows through those components
to provide production reports and ad hoc reports, and to allow Excel to
access Dynamics AX OLAP data.
Data Flow Overview
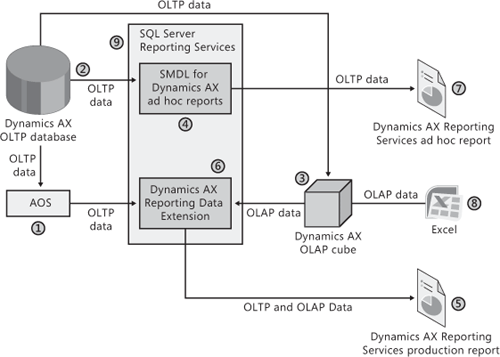
Figure 1 shows the components of and the data flow in the Reporting Services reporting framework.

Each of the key components shown in Figure 1 is described in the following list. Every number in the figure corresponds to an item in the list.
Application Object Server (AOS)
The AOS is the core of the Dynamics AX server platform. Dynamics AX
production reports retrieve Dynamics AX OLTP data via the AOS.
Dynamics AX OLTP database
This database stores the raw transactional data in the Dynamics AX
system. In general, users shouldn’t access this database directly but
must instead go through the AOS to maintain security. (Reporting
Services ad hoc reports are an exception because security is maintained
using SQL views [“secure views”] instead of the AOS.)
Dynamics AX OLAP cube This OLAP cube contains the aggregated and sliced analysis of the OLTP data.
Semantic Model Definition Language (SMDL)
SMDL models are published to the Reporting Services server; they enable
users to create and use ad hoc reports that retrieve Dynamics AX OLTP
data.
Dynamics AX Reporting Services production reports
These reports always communicate via the Dynamics AX Reporting Data Extension on the Reporting Services server.
The Dynamics AX Reporting Data Extension allows the production reports to access Dynamics AX OLTP and OLAP data.
When accessing Dynamics AX OLTP data, the Dynamics AX Reporting Data Extension always goes through the AOS.
Dynamics AX Reporting Data extension
Dynamics AX Reporting Services ad hoc reports
Ad hoc reports (7) don’t fetch OLTP data (2) via the AOS (1). Instead, they connect to the OLTP database (2) directly.
When
the IT staff initially configures ad hoc reporting, SQL views (“secure
views”) are created in the OLTP database that maintain Dynamics AX
security when the views are accessed directly from a Reporting Services
ad hoc report. Again, OLAP data is fetched directly from the OLAP cubes.
Reporting Services Production Reporting Technical Scenario
Once
Dynamics AX 2009 has been deployed and configured to use Reporting
Services, a developer can create a report and have it show data. In the
following list, we walk you through the steps for creating a production
report in more detail. The numbers in brackets refer to Figure 1.
1. | A user clicks a menu item attached to a report in the Dynamics AX client.
|
2. | Microsoft Internet Explorer is launched with the URL to the report.
|
3. | Internet Explorer requests the report from the Reporting Services server [9].
|
4. | The Reporting Services server [9] asks the Dynamics AX Reporting Data Extension [6] for any data the report uses.
|
5. | Depending on the report, the Dynamics AX Reporting Data Extension can fetch data from the following sources:
The Dynamics AX OLTP database [2] via the AOS [1] (The AOS enforces the security.) Directly from a Dynamics AX OLAP cube [3] (Developers should have previously secured the cubes as needed.) Some custom source of data
|
6. | The Dynamics AX Reporting Data Extension [6] sends the data back to Reporting Services [9].
|
7. | Reporting Services [9] renders the report as HTML.
|
8. | Reporting Services sends the HTML to Internet Explorer.
|
9. | Internet Explorer displays the report.
|
10. | The user views the report [5].
|
Reporting Services Ad Hoc Reporting Technical Scenario
Once
Dynamics AX 2009 has been deployed and configured to use Reporting
Services ad hoc reporting, a users can create a report. The following
steps describe how to create an ad hoc report. The numbers in brackets
refer to Figure 1.
1. | A user downloads and installs SQL Server Report Builder 2.0.
|
2. | The user creates a new report.
|
3. | The user can have the report fetch Dynamics AX OLAP or OLTP data.
|
4. | The user publishes the report to the Reporting Services server.
|
5. | The user then launches Internet Explorer and goes to the report.
|
6. | Internet Explorer requests the report from the Reporting Services server [9].
|
7. | The Reporting Services server fetches Dynamics AX data.
|
8. | Reporting Services renders the report as HTML.
|
9. | Reporting Services returns the HTML to Internet Explorer.
|
10. | Internet Explorer displays the report.
|
11. | The user views the report [7]. |