There are several settings available for the PPS
service application. These settings apply to specific service
applications so can only be applied at the web application level.
To access the PerformancePoint Service Settings section, follow these steps:
1. | Browse to the SharePoint Central Administration site.
|
2. | In
the section called Application Management, click Manage Service
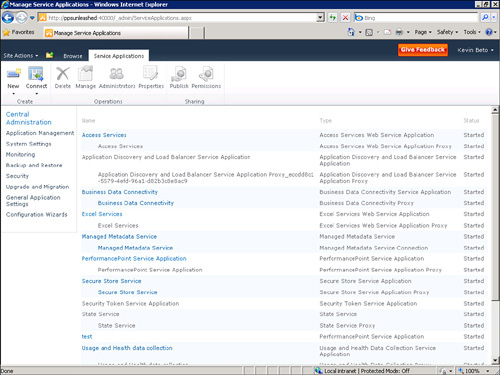
Applications. This displays a list of SharePoint Service Applications,
as shown in Figure 1.
|
3. | Find
the name of the service application you want to manage, and then click
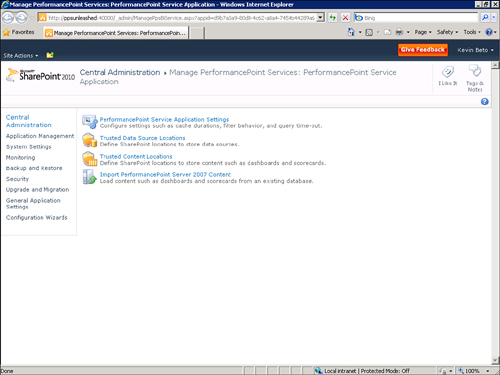
the link for the service application. This displays the Manage
PerformancePoint Services page, as shown in Figure 2.
|
PerformancePoint Service Settings
The family of
PerformancePoint Service settings can be accessed from the Manage
PerformancePoint Services page by clicking the PerformancePoint Service
Application Settings link.
For the most part, these
settings offer controls to limit the performance impact of some of the
more expensive operations available to you through PPS.
Secure Store and Unattended Service Account
Connection to the data
source can occur through Per-User Authentication or, if this is not
available, through the Unattended Service Account. The credentials for
the Unattended Service Account are stored with a Secure Store Service
Application, so they are not kept in plaintext within the SharePoint
config database.
Tip
For
all data sources that will be used by PPS, make sure that the
Unattended Service Account is set to read-only access on any data
sources it needs access to. Ensuring this account has minimum
permissions on any data sources helps keep the data secure and minimize
attack surface area for bad guys to attack.
Note
In PPS 2007, the
Unattended Service Account was the identity of the application pool that
SharePoint was running in IIS. In PPS 2010, the Unattended Service
Account is a standalone configuration setting and is not inherited from
the application pool under which the service is running.
Comments
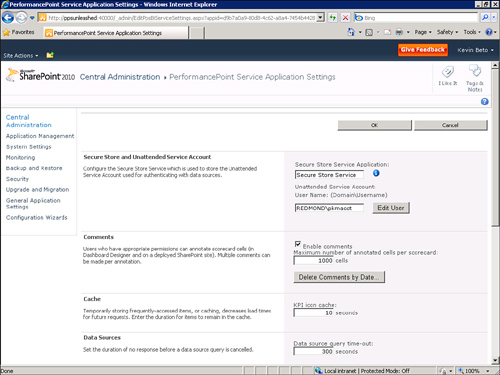
The Comments section, shown in Figure 3,
controls limitations on comments across all scorecards. These
limitations help control the performance implications of comments in
scorecards. In scorecards, comments add a hit to performance, whether or
not the comment is displayed.
Note
PPS 2010 uses the terms comments and annotations interchangeably.
You can configure the following settings for comments:
Enable Comments: If you do not intend to use comments, best practice is to disable Comments completely by clearing the check box.
Maximum Number of Annotated Cells per Scorecard:
This limits the number of comments that can be placed on a single cell
in a scorecard. The default is set to 1,000, which is probably more than
you will ever need. Best practice is to reduce the default value to a
more reasonable number. Too many unnecessary comments may slow
performance.
Delete Comments by Date:
Comments are never automatically deleted from scorecards. The
performance of scorecards may be impacted if you have a large number of
scorecards with many comments on each, even if the comments are not
displayed. Deleting comments by date removes all comments older than the
date you specify.
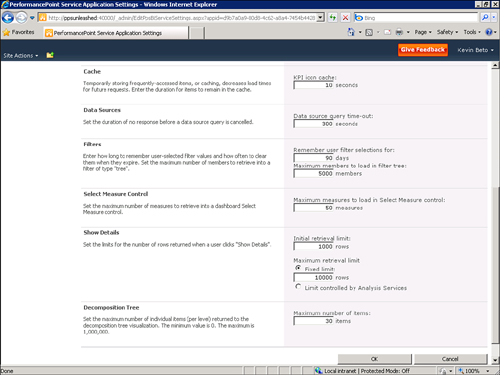
Cache
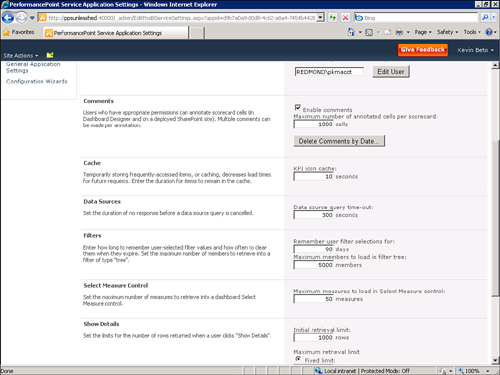
The values you enter for the KPI icon cache, shown in Figure 4,
control how many seconds a particular custom indicator is cached. This
applies only to custom indicators, as the default indicators are always
cached.
You
should never need to change this value as potential performance gains
are minimal. However, you may want to change this value in a deployment
where many large custom indicators are used in production. Increasing
this value allows PPS to do a more aggressive job of caching the custom
indicators and results in a slight performance improvement. The downside
is that changes to the indicators result in a delay for the changes to
the indicators to take effect.
Data Sources
The Data Sources setting, shown in Figure 5, is a PPS setting that determines how long a particular query may run before timing out.
Tip
If you encounter
timeout errors frequently, timeouts may be happening elsewhere. If your
deployment includes a SQL server or an IIS server, the timeout error may
be taking place on those servers. Remember to check timeouts on SQL
servers, IIS servers, and any other network hardware appliances included
in your deployment.
Filters
The family of settings for filters, shown in Figure 6,
primarily applies to the user experience of filters on a deployed
dashboard. The Remember User Filter Selections For setting specifies how
long the filter settings apply when specified here.

In
addition, it is possible to control the maximum number of members that
will be returned in a filter. Doing so proves useful when users are
working with large dimensions such as time. It is also useful if users
select a flat dimension, which could have a significant performance
impact on the server.
Select Measure Control
This setting, shown in Figure 7,
limits the number of measures that can be returned when a user attempts
to add more measures to an analytic chart or grid on a dashboard.

Analytic charts and
grids are flexible enough that designing may occur on-the-fly. For
example, while viewing an analytic line chart displaying viewers per
episode, a user may also want to add an additional line to the chart
displaying revenue per episode. If the data source has more than the
maximum number of measures specified, it will truncate the number of
measures displayed to this value.
Querying for measure
information can be an expensive operation in terms of performance and
will result in long loading times. This setting enables you to manage
for performance. Change to a higher value if you have data sources with
more than 1,000 measures. Change to a lower value if you have smaller
cubes, but it is important to note that changing this value has no
practical effect unless the number of measures in a cube crosses the
limit you set. In addition, setting this value to 0 effectively disables
the ability to add measures to analytic reports.
Show Details
There are two settings available under the Show Details heading, shown in Figure 8.
The Initial Retrieval Limit setting governs how many rows are returned
when a user first accesses the show details functionality. For example,
if the retrieval limit is set to 10 rows, only 10 rows at a time display
when a user requests a show details report, even if there are more than
10 rows to be returned overall.
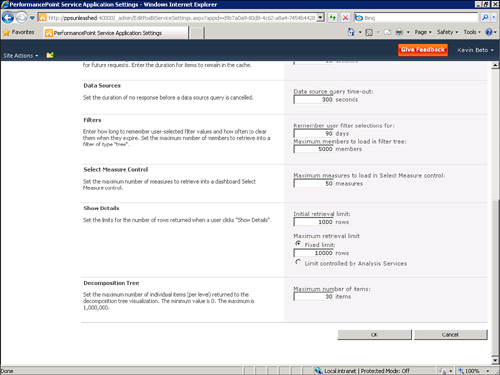
After the completion of
the initial retrieval, a user may retrieve more rows if the data is what
is expected. In this case, the Fixed Limit setting controls how many
rows will be returned in subsequent retrievals. There also is an option
to have the limit controlled by Analysis Services, which uses the
Analysis Services limit, which is controlled by the
OLAP\Query\DefaultDrillthroughMaxRows server property.
Decomposition Tree
The decomposition tree
visualization is a new feature in PPS 2010. If your users will be using
the decomposition tree visualization frequently, best practice is to
limit the number of items that can be returned, to help limit the
performance impact on the data source. The setting for this is shown in Figure 9.

If
you drill down to a level of a decomposition tree that has more items
than this setting, for example a date dimension with 1,000 members, PPS
retrieves only the top 250 members of this dimension instead of
retrieving and subsequently displaying all members of this dimension.
This enables users to page through the top 249 members in the dimension.
Other members will be shown as Bottom 751 as an aggregated value not
directly accessible to the user through the decomposition tree
visualization.
If in this same example
you change this setting to 10, the user can see only the top 9 members,
and the other 991 members will be aggregated as Bottom 991. If the user
wants to see the smallest values first as opposed to the top values, the
bottom 9 values will be shown as the Top 991.
Trusted Data Source and Content Locations
For enhanced security, a
PPS service application can further lock down which objects are
available for use by a user. In the case of data sources, a list of
trusted data source locations enables an administrator to restrict the
ability for PPS to use a data source that is not explicitly located in a
trusted location. If a user does try, PPS denies access and gives an
error message indicating that the administrator has denied a data source
from that location. In the case of other PPS objects, access can be
restricted in the same way with trusted content locations.
This feature
mitigates against malicious user attacks that take advantage of the
unattended service account to create their own data source list in a
site or site collection that they have access to and where they can
potentially elevate their privileges to view data that the unattended
service account does have access to. For trusted content locations, the
malicious user could use existing data sources and create their own KPIs
that would expose some of that data that an administrator might not
want exposed.
This can apply to data sources
or to PPS content lists, which include key performance indicators
(KPIs), scorecards, indicators, and reports. This family of settings
enable you to secure data sources further. They also enable you to
access content by clicking either Trusted Data Source Locations or
Trusted Content Locations on the Manage PerformancePoint Services page.
Best practice is to
configure these settings when you run the Unattended Service Account as a
highly privileged account with broad access to sensitive data (for
example, human resources or financial data). Best practice is also to
restrict any data sources that can be used for that service application
to one specific data source list with tightly controlled permissions.
You can grant trust to site
collections, sites, or document libraries. This trust used in
conjunction with restricting write access to these trusted locations
through SharePoint security allows all users to take advantage of
configured data sources while protecting data from inadvertent changes.
It also takes advantage of elevated permissions through the Unattended
Service Account.
Tip
The Trusted Data
Source Locations and Trusted Content Locations options share similar
concepts and user interfaces. The only difference is that the Trusted
Data Sources Location settings take effect on a data sources list,
whereas the Trusted Content Location settings take effect on a
PerformancePoint Services content list. You often want to lock down data
sources tighter than content locations. This is because the Unattended
Service Account may be used to access data sources but is never used to
access content locations.
Configuring a Trusted Data Source Location
When you configure a
trusted data source location, lock the data source for the service
application to one specific SharePoint list.
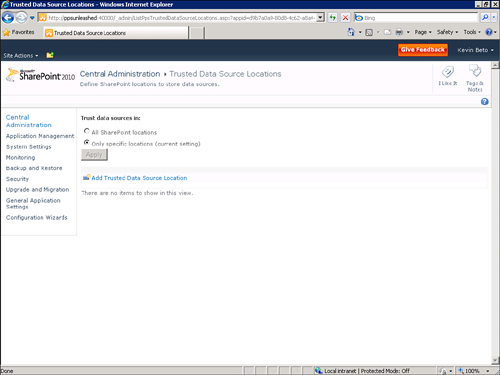
To configure a trusted data source location, follow these steps:
1. | From the PerformancePoint Service Settings page, click Trusted Data Source Locations.
|
2. | Change the radio selection from All SharePoint locations to Only Specific Locations, and then click Apply.
Caution
After you perform step 2, all
data source locations will be inaccessible to PPS users until you
configure all specific locations.
|
3. | Click Add Trusted Data Source Location, as shown in Figure 10.
|
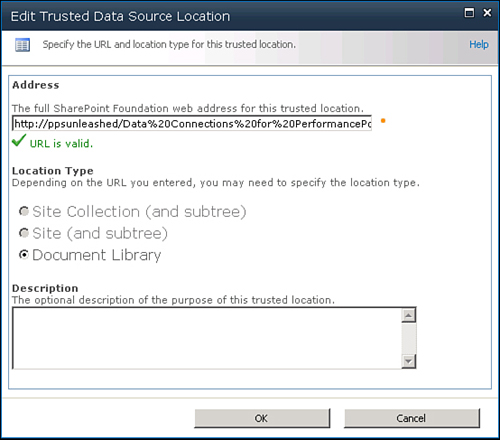
4. | Enter the full URL of the data source document library that can be accessed by PPS users, and then click OK (see Figure 11).
|
When you complete
this configuration, only data sources within the list of trusted
locations will be available to users of Dashboard Designer and to
previously deployed dashboards. Data sources outside the list of trusted
locations will not be available to these users or to the dashboards.