ConfigMgr 2007 uses dashboards to present
several related reports on a single page. This section creates a
dashboard to display the overall status of the sites in your hierarchy,
the number of errors reported by each site in the past 12 hours, and the
fatal errors by component and by computer. To create the dashboard,
perform the following steps:
1. | Expand
the Configuration Manager console tree to System Center Configuration
Manager -> Site Database -> Computer Management -> Reporting.
|
2. | Right-click the Dashboard’s node and choose New Dashboard.
|
3. | On
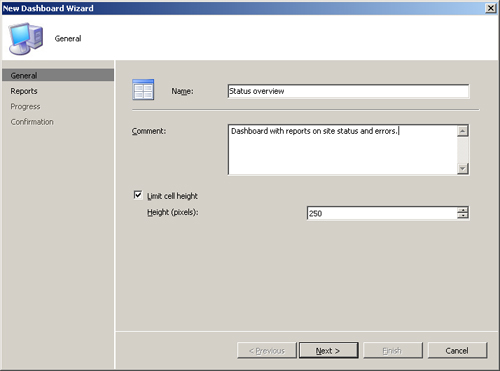
the New Dashboard Wizard General page, enter the name for your
dashboard, an optional comment, and the maximum height in pixels for the
cells that contains individual reports. The default value for the
maximum cell height is 250 pixels. Click Next to continue. Figure 1 shows the New Dashboard Wizard General page.

|
4. | On
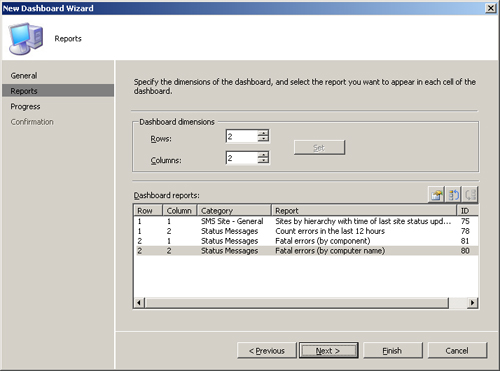
the Reports page, select the dimensions of the dashboard in rows and
columns and the reports you want to include in the dashboard. Click Next
to complete the Reports page, and Close when you receive confirmation
the dashboard has been successfully created. The Reports page provides
buttons to select reports and move them up or down in the display order. Dashboards can include only those reports that do not require prompted values. Figure 2 shows the New Dashboard Wizard Reports page.

|
You can view the dashboard by navigating to the
Configuration Manager console Dashboards node, right-clicking the
dashboard and selecting Run. Alternately, you can open the Reporting
Site home page in your web browser and navigate to the dashboards node
of the Report Viewer. Figure 3 shows the Status overview dashboard as rendered in the ConfigMgr console.