How Network Monitor Works
Network Monitor tracks the network data stream,
which consists of all of the information transferred over a network at
any given time. Before transmission, the networking software divides
this information into smaller segments (frames), each of which contains
the following information:
The source address of the computer that sent the message
The destination address of the computer that received the frame
Header information of each protocol used to send the frame
The data (or a portion of it) being sent to the destination computer
The Windows Server 2003
version of Network Monitor can copy to a buffer the frames originating
from or sent to the local computer. The process by which Network Monitor
copies frames is referred to as data capture.
The amount of
information that Network Monitor can capture is limited only by the
amount of memory available on your system. However, you usually need to
capture only a small subset of the frames traveling on your network. To
isolate a subset of frames you can design a capture filter, which
functions like a database query, to isolate the information that you
specify. You can filter frames on the basis of source and destination
addresses, network interface-layer protocols, internet-layer protocols,
transport-layer protocols, protocol properties, and pattern offset.
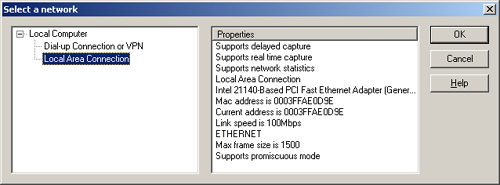
Examining the Network Monitor Interface
When you launch Network Monitor for the first time after installation, the Select A Network window opens, as shown in Figure 3-1,
and prompts you to choose a particular network adapter through which
Network Monitor should analyze traffic. The network you choose becomes
the default listening network for Network Monitor whenever you open the
tool. You can later access this window in Network Monitor by opening the
Capture menu and selecting Networks. This allows you to switch
listening networks after the first use.
After
you select a network from the Select A Network window, this window
closes, and the Capture window appears. The Capture window, which is the
main window of Network Monitor, provides different types of useful
statistical data for analyzing overall network performance. This window
includes a graph pane, a session statistics pane, a station statistics
pane, and a total statistics pane, as shown in Figure 2.
Table 2 describes the type of data summarized in each of these four panes.
Table 2. Network Monitor Capture Window
| Pane | Description
|
|---|
| Graph | Displays
the current activity as a set of bar charts indicating the following
status information: % Of Network Utilization, Frames Per Second, Bytes
Per Second, Broadcasts Per Second, and Multicasts Per Second during the
capture process |
| Session statistics | Displays a summary of the conversations between two hosts, and indicates which host is initiating broadcasts and multicasts |
| Station statistics | Displays
a summary of the total number of frames initiated by a host, the number
of frames and bytes sent and received, and the number of broadcast and
multicast frames initiated
|
| Total statistics | Displays
statistics for the traffic detected on the network as a whole, the
statistics for the frames captured, per second utilization statistics,
and network adapter card statistics |
Capturing Data in Network Monitor
To
begin capturing data in Network Monitor, from the Capture menu, select
Start. Alternatively, to start a capture you can also press F10 or click
the Start Capture button on the toolbar. The Start Capture button is
designated by the play symbol shown in Figure 3.
When packets are being
captured, you will see new data being registered in the panes of the
Capture window. To stop the capture, from the Capture menu, select Stop.
Alternatively, to stop a capture you can also press F11 or click the
Stop Capture button on the toolbar. The Stop Capture button is
designated by the stop symbol shown in Figure 3-3.
To view a capture, from
the Capture menu, select Display Captured Data. Alternatively, to view a
capture you can also press F12 or click the Display Captured Data
button on the toolbar, which is designated by the eyeglasses symbol
shown in Figure 3-3.
You can also stop and
view the data in one step. To perform this task, from the Capture menu,
you can select Stop And View while the data is being captured.
Alternatively, to stop the capture and view the results immediately, you
can also press Shift+F11 or click the Stop And View Capture button on
the toolbar. The Stop And View Capture button is designated by a
combination of the stop symbol and the eyeglasses symbol shown in Figure 3-3.
Tip
You
can use Network Monitor to find out certain details—such as the MAC
address of a network interface card (NIC), the globally unique
identifier (GUID) of a client computer, or the port used by a
protocol—that might have been lost with documentation. |
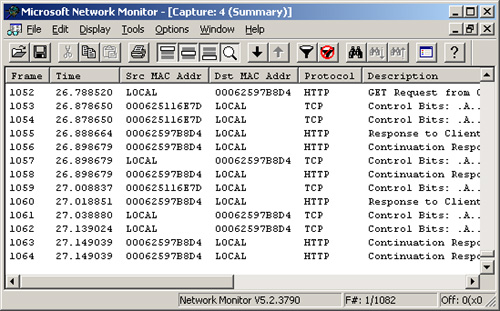
Analyzing Captured Data
When
you choose to view a capture, the Frame Viewer window appears,
displaying the summary pane. The summary pane displays all of the
captured frames in sequence, as shown in Figure 4.
By double-clicking
any frame in the summary pane, you can toggle between the original
summary pane view and the three-pane view, which includes the summary
pane, the details pane, and the hexadecimal (hex) pane. Figure 5 shows the three-pane view of the Frame Viewer window.
The following sections describe the function of these three panes.
Summary Pane
The
summary pane lists all frames that are included in the current view of
the captured data. When a frame is highlighted in the summary pane,
Network Monitor displays the frame’s contents in the details pane and
hex pane.
You can sort (by clicking the mouse), move, and resize the following nine columns in the summary pane:
Frame
All frames captured during one capture session are numbered in the
order of capture time. The frame number, beginning with 1, appears in
this column. Remember that frames can be received in a different order
than they are sent.
Time
This column displays the frame’s capture time relative to the beginning
of the capture process. It can be configured to display the time of day
when the frame was captured, or time elapsed since the previous frame
capture.
Src MAC Addr (source MAC address) This column displays the hardware address of the computer that sent the frame or the router that forwarded it.
Dst MAC Addr (destination MAC address) This column displays the hardware address of the target computer.
Protocol This column lists the highest protocol that Network Monitor recognizes within the frame.
Description
This column contains a summary of the frame’s contents. The summary
information can show the first protocol used in that frame, the last
protocol used in that frame, or an automatic selection.
Src Other Addr (source other address)
This column displays an additional identifying address for the
originator of the frame, other than the MAC address. This address might
be an IP or Internetwork Packet Exchange (IPX) address.
Dst Other Addr (destination other address) This column is the same as Src Other Addr, except it gives the destination of the frame instead of the source of the frame.
Type Other Addr (type other address)
This column specifies which type of address is displayed in the
previous two columns (for example, if the Src Other Addr and Dst Other
Addr fields are displaying IP or IPX addresses).
Details Pane
The details
pane displays protocol information for the frame currently highlighted
in the summary pane. When a frame contains several protocol layers, the
details pane displays the outermost level first. When you select a
protocol in the details pane, the associated hexadecimal strings are
highlighted in the hex pane.
Hexadecimal Pane
The
hex pane displays in hexadecimal format the content of the selected
frame. When information is selected in the details pane, the
corresponding hexadecimal data appears highlighted in the hex pane. This
area can be useful, for example, to developers who need to determine
precise information about a network application protocol.
Looking Within Frames
The Frame Viewer
window details pane shows the various protocols contained within a
frame. In terms of networking models, the protocols are presented with
the lowest layers (such as the network interface layer protocol
Ethernet) appearing highest, and the highest layers (such as the
application layer protocol DNS) appearing lowest. This pattern occurs
because Network Monitor presents all data in the order in which it is
received on the wire.
The following
example represents a frame captured from the Computer Browser service,
viewed in the Frame Viewer window details pane:
+ Frame: Base frame properties
+ ETHERNET: EType = Internet IP (IPv4)
+ IP: Protocol = UDP - User Datagram; Packet ID = 1576;
    Total IP Length = 236; Options = No Options
+ UDP: Src Port: NETBIOS Datagram Service (138);
    Dst Port: NETBIOS Datagram Service (138); Length = 216 (0xD8)
+ NBT: DS: Type = 17 (DIRECT GROUP)
+ SMB: C transact, File = \MAILSLOT\BROWSE
+ Browser: Workgroup Announcement [0x0c] WORKGROUP
Each protocol is
presented here in collapsed or summary form. You can expand the complete
protocol information by clicking on any plus symbol. The first layer,
frame, is added by Network Monitor to describe the frame. This
description includes data such as total frame length and time change
from previous frame. The next layer, Ethernet, is the outermost protocol
of the captured frame and corresponds to the network interface layer of
the TCP/IP model. The internet layer follows with the IP protocol.
Within this particular protocol stack, the User Datagram Protocol (UDP)
is used as the TCP/IP transport-layer protocol.
Network Monitor and the OSI Model
The final three
protocols shown in the previous frame example are Microsoft network
protocols that are not part of the standard TCP/IP stack. Because these
protocols were not originally built on TCP/IP, they are sometimes
referred to by their position within the older, more general Open
Systems Interconnection (OSI) networking model. The OSI and TCP/IP
networking models are compared in Figure 6.
An
example of a protocol described most often by its position within the
OSI model occurs with the next protocol listed in the sample frame, the
session-layer interface NetBT. NetBIOS over TCP/IP (NetBT), represented
as NBT in Network Monitor, was designed to connect the transport-layer
protocols of TCP/IP—TCP and UDP—to the higher NetBIOS network programs,
such as Client for Microsoft Networks, used by Microsoft network
protocols.
Tip
For the exam, remember that NetBT is an example of a session-layer interface. |
The next protocol in
the frame, Server Message Block (SMB), traditionally runs on NetBIOS and
allows files and folders to be shared over a Microsoft network.
(Although this protocol has been extended and officially renamed Common
Internet File System [CIFS], it is still recognized in Network Monitor
as SMB.) Finally, the last protocol in the frame is referred to as
Browser. It represents the Computer Browser service, which runs on top
of SMB and allows users to browse network elements in Windows.
