Performance Console Differences
You will want to use the Performance console when you have big jobs to handle.
Note
The Performance console was called Performance Monitor in earlier versions of Windows. |
Although Task Manager is
good for getting a snapshot of the local server’s network performance,
the Performance console provides detailed information necessary for
indepth analysis and an alerting feature useful for detecting problems
before the symptoms become obvious.
Starting the Performance Console
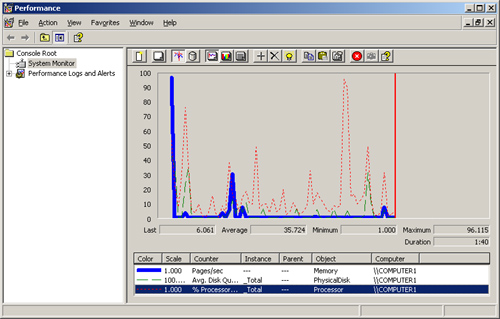
You can start the Performance console in various ways. One of the simplest methods is to open the Start menu, select Run, type perfmon.exe, and click OK. Performance Monitor launches (see Figure 4) and automatically starts with three of the most used counters:
Pages/Sec
shows how often memory pages are being swapped in and out of random
access memory (RAM) to disk. High sustained values here could indicate
not having enough RAM.
Avg.
Disk Queue Length shows how many disk events are in queue by the disk
subsystem. High sustained values could indicate not having a fast enough
disk subsystem.
%
Processor Time shows how much processor is being used. High sustained
values could indicate not having a fast enough processor.
Adding Network Counters
The
Performance console is capable of sampling a huge range of performance
counters—many more than Task Manager. Indeed, it can monitor many more
networking and non-networking components that fall into several separate
categories, as shown in Figure 5.
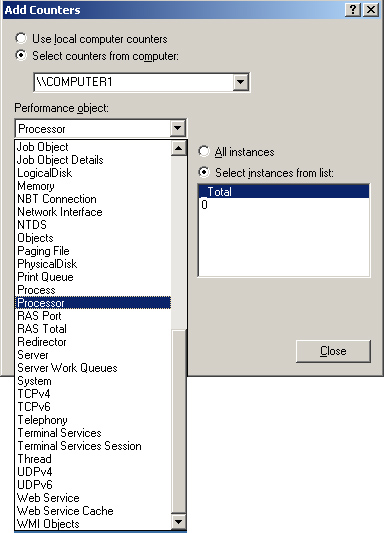
Note
The categories available to you might vary based on installed server software. |
However, our focus is on monitoring the networking items. The following list describes the key networking performance objects:
Network Interface
This object contains some of the same counters that you find when using
Task Manager. However, it also contains counters for monitoring
specific details about packets on the network.
TCPv4 This object contains counters related to Transmission Control Protocol (TCP) version 4 connections.
TCPv6 This object contains counters related to TCPv6 connections.
NBT Connection
This object contains counters that can help you determine the number of
connections through Server Message Block (SMB); usually open shares.
RAS Port This
category is helpful if you have virtual private network (VPN) or other
Remote Access Service (RAS) connections set up. Then you can choose to
troubleshoot your connection problems based on specific ports. You can
check the errors on a port or other counters like the Percent
Compression Out.
RAS Total
This object contains counters that show overall aggregate RAS
performance, as opposed to the RAS Port object, which can help with a
specific port.
Using the Performance Console to Create Alerts
You have seen that Task Manager is an easy-to-use tool, and you already
know that the Performance console is a powerful tool. How do you know
when it’s best to use which tool? You might choose to use the
Performance console over Task Manager for two main reasons:
You have already seen
that dozens of counters are available through the Performance console.
Now let’s take a look at the Performance console’s second big strength—triggered alerts.
Although the
Performance console works well when systems are actively performing
poorly, when you can’t wait around, you can set up triggers using the
Performance console to catch bad systems in action. For instance, you
might want to be alerted when a certain system is particularly busy
handling network traffic or has generated errors on the network.
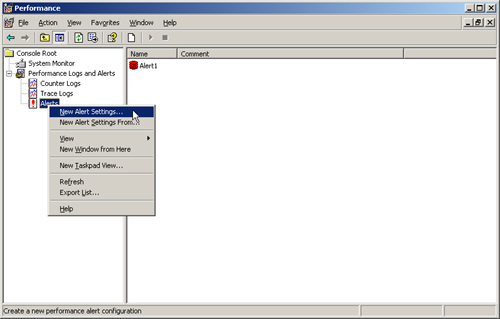
To start, you create
alerts in the Performance Logs And Alerts snap-in in the Performance
console. Right-click Alerts and select New Alert Settings, as shown in Figure 6.
You
typically name the alert based on the type of counter or counters you
want to monitor, and then you choose the counters. When you click the
Add button, as shown in Figure 7, you can choose the different categories of counters and then pick a specific counter.
Tip
Sometimes
you might want to choose more than one counter to trigger an alert. For
instance, you might choose to get a notification if both the network
bandwidth is heavy and high amounts of errors are being generated. |
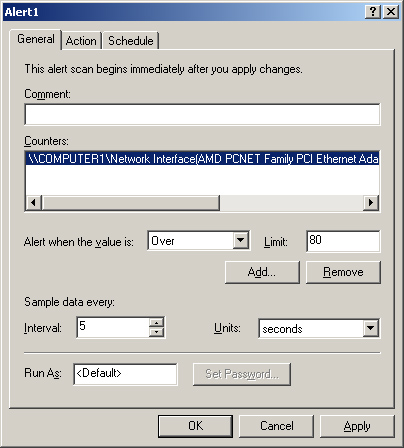
Before choosing how you
want the alert reported, on the General tab, you must specify several
specifics about how you want to sample the counters.
The following list describes some of the parameters you can configure on the General tab:
Comment
Even though the alert has a name, you can also supply a comment to help
you or others recall what the purpose of the alert is and to whom the
alert goes.
Alert When The Value Is You can specify whether to trigger if the alert is under the Limit value or over the Limit value.
Limit
You can specify the value of the counter to be monitored. When the
value goes over or under this limit (based on the selection in Alert
When The Value Is), the alert is triggered.
Interval You
can set how often the Performance console queries the system for what
you want to monitor. The system doesn’t continuously monitor for the
counters you want; rather, it performs samples over a certain amount of
time. The longer the interval, the less accurate the sample is because
it is being sampled less. The shorter the interval, the more accurate
the sample is, but the more the processor is used when getting the
sample.
Units
You can specify the units in time to collect samples. For instance, you
might not want to sample every 5 seconds; instead, you might want to
sample every 30 seconds. Again, if you reduce the frequency of sampling,
you’ll use fewer processor cycles, but you will be less accurate.
Run As
You can sample the counters by selecting either the System account or
another account of your choice. Occasionally, counters can be
user-specific, which is necessary. However, for monitoring
network-related counters, the System account has access to what it needs
to perform the work.
Tip
If
two or more counters are being monitored, you must select each counter
and set the Alert When The Value Is, Limit, Interval, and Units fields.
The Comment field and Run As field will be used for all counters in an
alert. |
After you set these parameters, you select the Action tab, as shown in Figure 8.
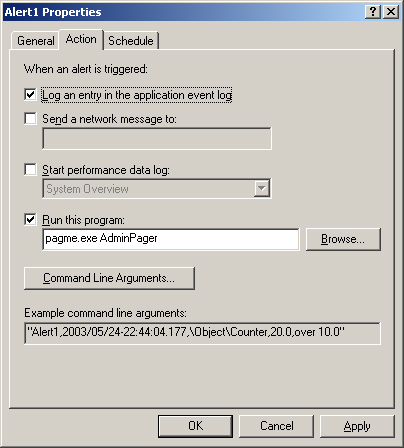
The
Action tab specifies what happens once an alert is triggered. A
multitude of options let you know that your counter’s criteria have been
met. The various options are as follows:
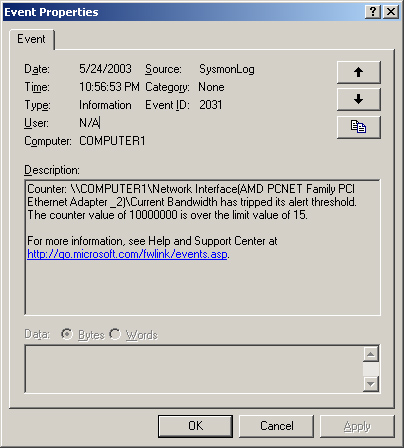
Log An Entry In The Application Event Log
Selecting this option puts an event in the event log, which you can see
using Event Viewer. A notice of the counter, value, and limit are part
of the log entry, as shown in Figure 9.
Send A Network Message To
Selecting this option sends the equivalent of a Net Send command with
the alert’s message. You need to specify the name of a computer here,
not a user. For messages to be sent out, the Alerter service must be
started on the machine from which you are doing the monitoring. For
messages to be received, the Messenger service must be started on the
receiving computer. Neither of these services runs on a newly installed
Windows Server 2003 server; you must manually change the state from
Disabled to Automatic and ensure that the services are running.
Start Performance Data Log
You can configure the alert system to start by writing additional
counters to a log file to be reviewed later. You need to preset the log
file by using the Counter Logs node within the Performance Logs And
Alerts node, as seen earlier in Figure 6.
Run This Program Once
your trigger has gone off, you can execute an external program. You
might have an external paging network or some other external alert
system to help you find out when triggers go off. Or, in the most
extreme case, you might choose to shut down the system when an alert is
triggered. You would perform this task by running the built-in
Shutdown.exe command found in Windows Server 2003.
Finally, you can
configure the settings on the Schedule tab, which help you determine
when to trigger. For instance, you might not want to get alerts at
off-peak times or on weekends. Or maybe you do! It’s your choice.
If you do not choose
to run the alert within a schedule through the Schedule tab, you must
manually start your alert. To do so, right-click the alert you just
created and select Start, as shown in Figure 10.
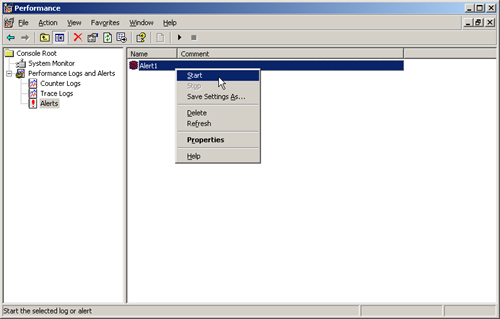
Once they are set up, your alerts can notify you of just about any network problem on your system.
