Monitoring Network Traffic with Netstat
One tool you can use to help monitor your traffic is a command-line tool called Netstat. Netstat provides information about existing network connections and network activity statistics.
For
instance, if you wanted to determine on which ports a system was
listening for connections, you could execute the Netstat –a command.
This would determine that the ports that you want closed are indeed
closed.
However, just knowing
which ports are open might not be enough data to close the hole. Indeed,
you will want to know which application is using that port so you can
further investigate the application and close the port. You can figure
out the relationship between open ports and applications with the
Netstat –o command. When you run the Netstat –o command, you can see the
protocol, the local inbound port that is open, the connection from or
to the other computer, and the port it is using, as shown in Figure 11.
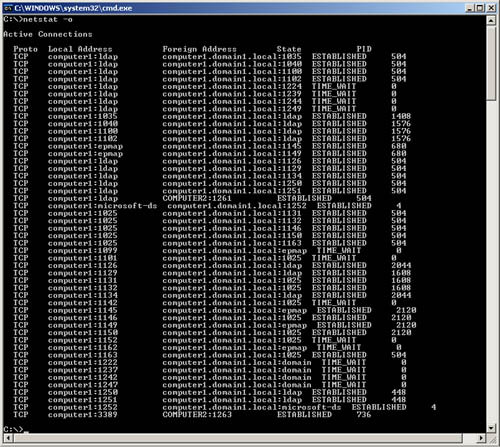
In this example, notice
that the last entry shows that Computer1 and Computer2 are communicating
over port 3389. In this specific instance, you can see that the Process
Identifier (PID) is 736. If you then want to correlate that PID with
the actual process that is using the port, you must return to Task
Manager.
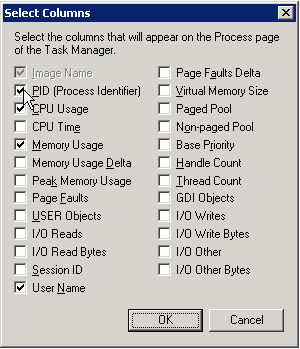
In Task Manager, you
can select the Processes tab. However, by default the Processes tab does
not display the PIDs of processes. You can choose to see the PIDs by
opening the View menu, selecting Columns, and selecting PID (Process
Identifier), as shown in Figure 12.
Then you will obtain a listing of the processes on the machine that includes the PIDs, as shown in Figure 13.
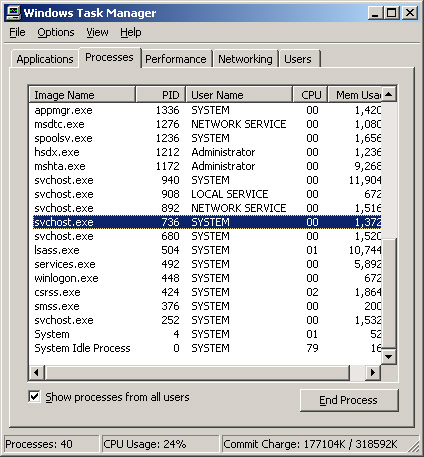
Simply match the PID and
the process, and you will know which process or application has the port
open. If your PID points to svchost, multiple services are probably
running as a single process. To see which services they are, run
Tasklist/svc. In this case, if you run Tasklist /svc, you will see that
the svchost that equates to this computer’s PID of 736 is for Terminal
Services. Terminal Services uses port 3389 for communications.
In this way, you can find applications and services that open ports and close the door if you want.
Windows Server 2003 “Lite” and “Full” Network Monitor Tools
The full version of the tool, which is available only by purchasing
Microsoft Systems Management Server, handles two tasks that the lite
version cannot:
It can run in promiscuous mode; in other words, it is able to capture 100 percent of the network traffic.
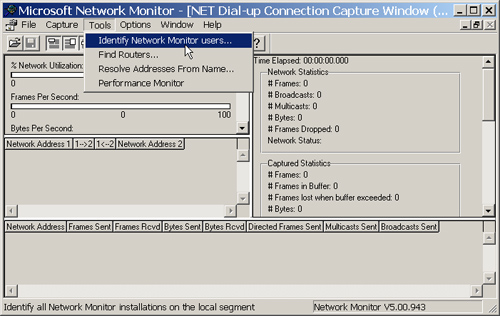
It
enables you to see where else Network Monitor is running. This
information is useful when you are setting up multiple monitoring
stations across your network and then using a central monitoring point
to collect the data. You can also use it to monitor and prevent inside
hack attempts by tracking down offenders, as shown in Figure 14.
Using Network Monitor Triggers
Network Monitor’s main
function is to capture packets as they cross the network. So much
occurs at once that trying to find the information you need is often
nearly impossible. Therefore, one important skill to master with Network
Monitor is the ability to quickly locate what you are looking for when
the action happens.
Setting Triggers Network
Monitor provides a facility to alert you once certain conditions are
met. This facility might be helpful under a variety of circumstances
where you set up Network Monitor and then decide to move on to other
tasks. You can set up this ability by using triggers. To configure a
trigger, start Network Monitor, and from the Caption menu, select
Trigger. The Capture Trigger dialog box opens, as shown in Figure 15.
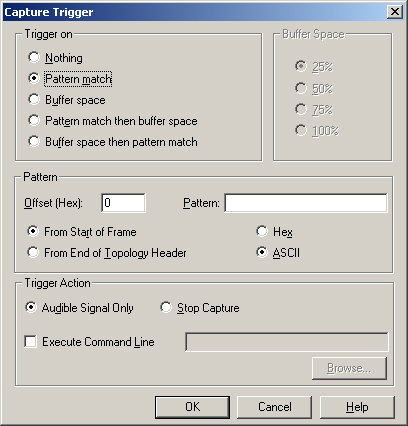
Capturing Trigger Options
The default Trigger On option is set to Nothing, which means no
triggers will be active. You can set up a trigger to alert you under
certain key conditions. For instance, you can be notified when the
buffer space is 25 percent, 50 percent, 75 percent, or 100 percent full.
This might be your signal to take a look and clean it out before any
packets are lost because of low buffer space.
You might also
decide to use the handy Pattern Match feature (selected in the figure),
which allows you to type in a hex or ASCII representation of what you
want to find. For instance, you could look for any instance of a clear
text string of characters, and then, by using the Execute Command Line
option, have a message sent to you saying that your text string was
found.
