Looking at Alternatives with Data Tables
Data tables provide a shortcut by calculating all of the values in one operation. A data table
is a range of cells that shows the results of substituting different
values in one or more formulas. For example, you can compare loan
payments for different interest rates. There are two types of data
tables: one-input and two-input. With a one-input table, you enter different values for one variable and see the effect on one or more formulas. With a two-input table, you enter values for two variables and see the effect on one formula.
Create a One-Input Data Table
 Enter the formula you want to use.
If the input values are listed down a column, specify the new formula in
a blank cell to the right of an existing formula in the top row of the
table. If the input values are listed across a row, enter the new
formula in a blank cell below an existing formula in the first column of
the table.
 Select the data table, including the column or row that contains the new formula.
 Click the Data tab.
 Click the What-If Analysis button, and then click Data Table.
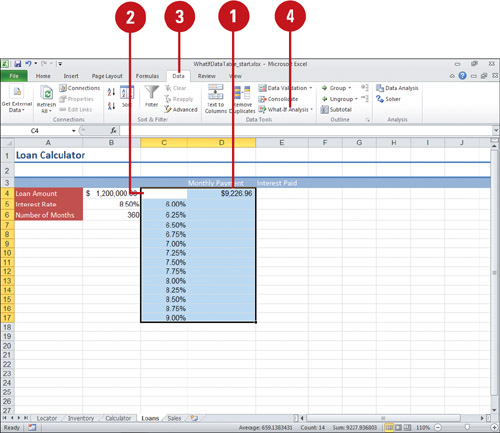
 Enter the input cell.
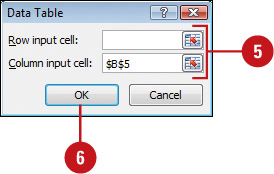
If the input values are in a column, enter the reference for the input
cell in the Column Input Cell box. If the input values are in a row,
enter the reference for the input cell in the Row Input Cell box.
 Click OK.
Asking “What If” with Goal Seek
Excel
functions make it easy to create powerful formulas, such as calculating
payments over time. Sometimes, however, being able to make these
calculations is only half the battle. Your formula might tell you that a
monthly payment amount is $2,000, while you might only be able to
manage a $1,750 payment. Goal Seek enables you to work backwards to a desired result, or goal, by adjusting the input values.
Create a “What-If” Scenario with Goal Seek
- Click any cell within the list range.
- Click the Data tab.
- Click the What-If Analysis button, and then click Goal Seek.
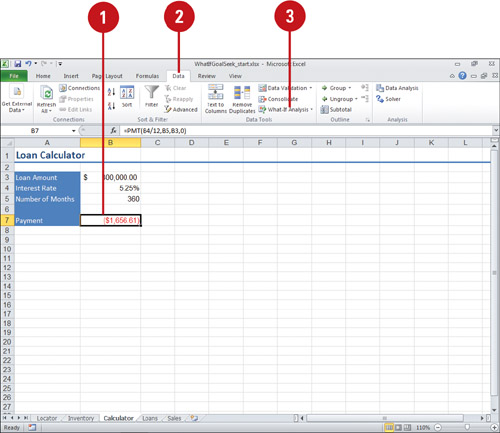
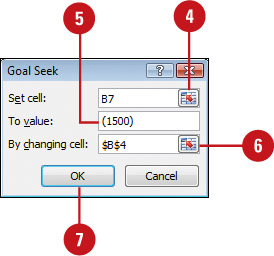
- Click the Set Cell box, and then type the cell address you want to change.
You can also click the Collapse Dialog button, use your mouse to select the cells, and then click the Expand Dialog button.
- Click the To Value box, and then type the result value.
- Click the By Changing Cell box, and then type the cell address you want Excel to change.
You can also click the Collapse Dialog button, use your mouse to select the cells, and then click the Expand Dialog button.
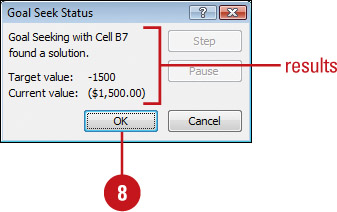
 Click OK.
The Goal Seek Status dialog box, opens displaying the goal seek results.
 Click OK.