1. Applying Themes to Your Diagrams: Part 1
Visio 2007 introduced the idea of themes. A theme is a coordinated set of background, fill, line, and accent colors. Visio 2007 also introduced theme effects,
which can include specific fonts, fill patterns, shadows, and line
styles. The Visio 2010 themes are very similar to those in 2007 but are
easier to use because they take advantage of Live Preview.
Whether used individually or
together, themes and theme effects are a fast and powerful way to alter
the appearance of a Visio drawing. Well-chosen themes can add a
distinctive and professional appearance.
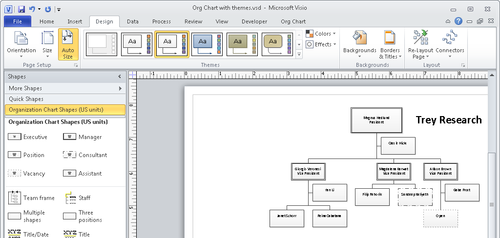
Turn off the grid lines as described in the preceding exercise.
Set the zoom level to approximately 75%
and position the organization chart on the right side of the Visio
window. This combination of size and position settings looks odd, but it
enables you to see Live Preview effects in most of the chart when you
use the Themes gallery in subsequent steps.
Text

On the Home tab, in the Tools group, click the Text tool, and then and use it to add a text block to the right of the Magnus Hedlund shape.
In the new text block, type Trey Research, and press Esc. Then on the Home tab, in the Font group, set the font to 24 pt. and Bold. You will use this text block later in this exercise as you work with theme colors.
On the Design tab, in the Themes
group, point to a few of the displayed themes and observe the Live
Preview effects in the drawing. Notice the tooltip text that contains a
name and description for each theme color set.
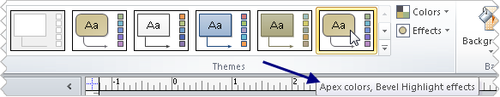
Tip:
The theme color names (Apex
in the previous example) are fabricated names that serve merely to
distinguish one set of colors from another. Don’t look for any
significance or meaning in the names.
Click
the rightmost theme to apply it to your organization chart and notice
that it includes rounded corners, a bevel effect on each shape, curved
connector lines, and a beige color. (You may need to zoom in to see the
beveled edges.)
Tip:
Notice that Visio has
changed the colors of the masters in the Shapes window to reflect the
color and style of the theme you’ve chosen.
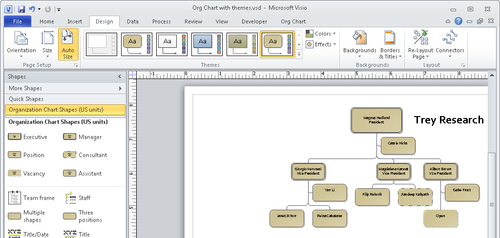
All the shapes in
your organization chart now display the theme settings, and they all
look essentially the same. In some situations, the homogenous appearance
is fine, but in many cases, you might want to use color to
differentiate among different types of shapes. In the next section, you
will see one technique for accomplishing this.
Note:
Save your changes to the Org chart with themes drawing and continue with the next exercise.
