SmartArt
is a special class of vector graphic object that combines shapes,
lines, and text placeholders. SmartArt is most often used to illustrate
relationships between bits of text.
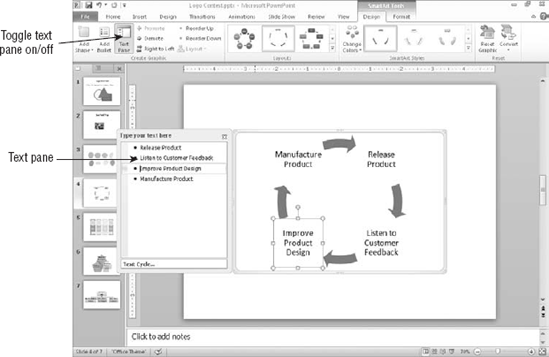
The SmartArt interface is
similar regardless of the type of diagram you are creating. You can type
directly into the placeholders on the diagram, or you can display a
Text pane to the side of the diagram and type into that, much as you
would type into an outline pane, to have text appear in a slide's text
placeholder boxes. See Figure 1. You can also select some text, right-click it, and choose Convert to SmartArt.
There are eight types of SmartArt diagrams in PowerPoint 2010, and each is uniquely suited for a certain type of data delivery.
1. List
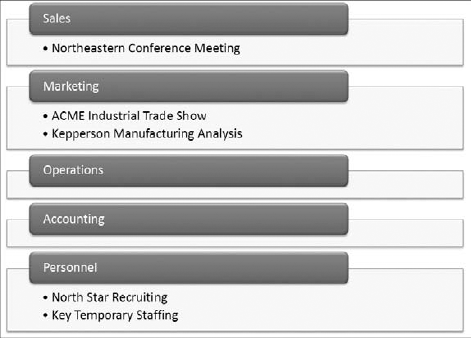
A List diagram
presents information in a fairly straightforward, text-based way,
somewhat like a fancy outline. List diagrams are useful when information
is not in any particular order, or when the process or progression
between items is not important. The list can have multiple levels, and
you can enclose each level in a shape or not. Figure 2 shows an example.
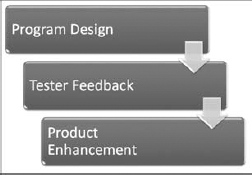
2. Process
A Process diagram is similar
to a list, but it has directional arrows or other connectors that
represent the flow of one item to another. This adds an extra aspect of
meaning to the diagram. For example, in Figure 3, the way the boxes are staggered and connected with arrows implies that the next step begins before the previous one ends.
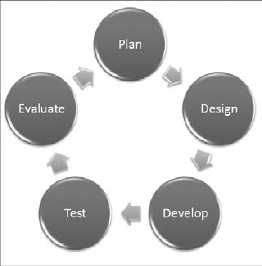
3. Cycle
A Cycle diagram also
illustrates a process, but a repeating or recursive one — usually a
process in which there is no fixed beginning or end point. You can jump
into the cycle at any point. In Figure 4, for example, the ongoing process of product development and improvement is illustrated.
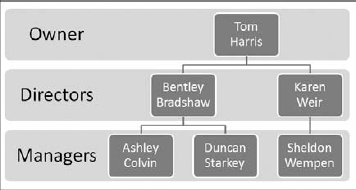
4. Hierarchy
A Hierarchy chart is an
organization chart. It shows structure and relationships between people
or things in standardized levels. For example, it can show who reports
to whom in a company's employment system. It is useful when describing
how the organization functions and who is responsible for what. In Figure 5,
for example, three organization levels are represented, with lines of
reporting drawn between each level. Hierarchy diagrams can also run
horizontally, for use in tournament rosters.
|
Should you include your
company's organization chart in your presentation? That's a question
that depends on your main message. If your speech is about the
organization, you should. If not, show the organization structure only
if it serves a purpose to advance your speech. Many presenters have
found that an organization chart makes an excellent backup slide. You
can prepare it and have it ready in case a question arises about the
organization. Another useful strategy is to include a printed
organization chart as part of the handouts you distribute to the
audience, without including the slide in your main presentation.
|
|
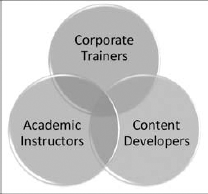
5. Relationship
Relationship diagrams
graphically illustrate how parts relate to a whole. One common type of
Relationship diagram is a Venn diagram, as in Figure 6,
showing how categories of people or things overlap. Relationship
diagrams can also break things into categories or show how parts
contribute to a whole, as with a pie chart.
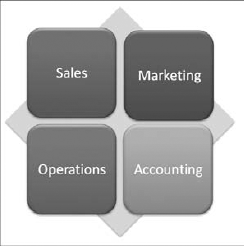
6. Matrix
A Matrix also shows
the relationship of parts to a whole, but it does so with the parts in
orderly looking quadrants. You can use Matrix diagrams when you do not
need to show any particular relationship between items, but you want to
make it clear that they make up a single unit. See Figure 7.
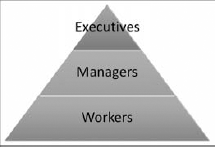
7. Pyramid
A Pyramid diagram is just what
the name sounds like — it's a striated triangle with text at various
levels, representing not only the relationship between the items, but
also that the items at the smaller part of the triangle are less
numerous or more important. For example, the diagram in Figure 8 shows that there are many more workers than there are executives.
|
Notice in Figure 11-8
that the labels do not confine themselves to within the associated
shape. If this is a problem, you might be able to make the labels fit
with a combination of line breaks (Shift+Enter) and font changes.
|
|
8. Picture
The Picture category is a
collection of SmartArt diagram types from the other categories that
include picture placeholders in them. You'll find List, Process, and
other types of diagrams here; the Picture category simply summarizes
them.
