Project 2010 includes two types of reports:
Visual reports—
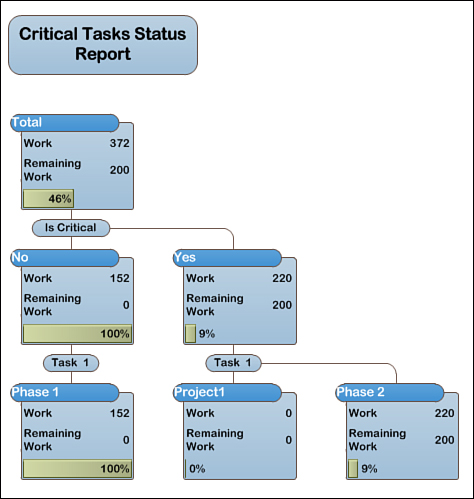
When you generate a visual report, your project data is exported to
Excel or Visio, for a highly illustrated report that takes advantage of
PivotTable and PivotChart features.
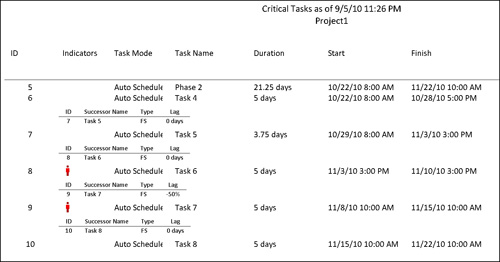
Basic reports— When you generate a basic report, your project data is formatted into a simple, printable report within Project 2010.
Figure 1 shows an example of a report generated using visual reports and Figure 2 shows a similar one generated using basic reports.
With both visual and basic
reports, not only can you generate them using your project data, but you
can also customize your own reports to show the data you need, in the
way that makes the most sense for your organization. The process for
generating and customizing reports is different based on which kind of
report you are using.
Generating and Customizing a Visual Report
Project 2010 comes with the visual report templates shown in Table 1.
Table 1. Available Visual Reports
| Excel | Visio |
|---|
| Baseline Cost Report | Baseline Report |
| Baseline Work Report | Cash Flow Report |
| Budget Cost Report | Critical Tasks Status Report |
| Budget Work Report | Critical Tasks Status Report |
| Cash Flow Report | Resource Availability Report |
| Earned Value Over Time Report | Resource Status Report |
| Resource Cost Summary Report | Task Status Report |
| Resource Remaining Work Report | |
| Resource Work Availability Report | |
| Resource Work Summary Report | |
Follow these steps to generate one of these visual reports:
1. | On the Project tab, in the Reports group, click Visual Reports.
|
2. | Click the name of the report you want to generate.
|
To narrow down the list of reports, you can click each tab on the Visual Reports—Create Report dialog box to view only reports that fit each category (such as Task Usage or Resource Summary,
for example). You can also choose to display only reports that open in
Excel or only those that open in Visio, by selecting or clearing the Microsoft Excel and Microsoft Visio check boxes. This filters the list of reports by whichever application you select.
|
|
3. | To choose the amount of usage detail you want to include in the report, select an option from the Select level of usage data to include in the report list.
|
A best practice is to leave the usage detail set to whatever Project uses as the default. In most cases, this will be Weeks. Including more detail (Days,
for example) may impact the performance of the report. If the report
you are generating doesn’t need to include usage data, choose Years to get the best level of performance for the report.
|
|
4. | Click View
to begin generating the report. Based on your selection, the report
will open in Excel or Visio, and you can modify what data is displayed
by using the PivotTable or PivotChart features within those
applications.
|
If the default visual
report templates included with Project 2010 don’t include the right data
to meet your needs, you can add or remove which fields are included in
the report.
To add or remove fields from an existing visual report template, follow these steps:
1. | On the Project tab, in the Reports group, click Visual Reports.
|
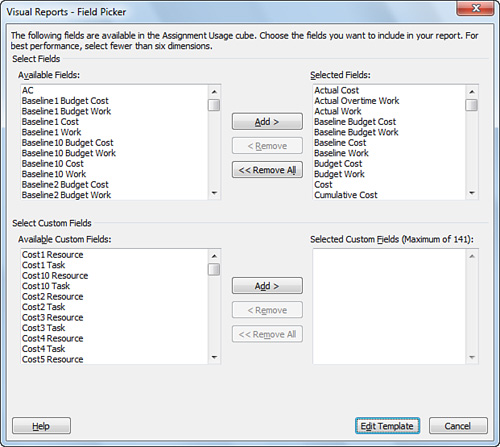
2. | Click the name of the report you want to modify and then click Edit Template. The Visual Reports—Field Picker dialog box appears, as shown in Figure 3.
|
3. | To add a built-in Project field to the report, under Select Fields, click the name of the field in the Available Fields box and then click Add to move it to the Selected Fields box.
|
4. | To remove a built-in Project field from the report, under Select Fields, click the name of the field in the Selected Fields box and then click Remove to move it to the Available Fields box.
|
5. | To add a custom field to the report, under Select Custom Fields, click the name of the field in the Available Custom Fields box and then click Add to move it to the Selected Custom Fields box.
|
6. | To remove a custom field from the report, under Select Custom Fields, click the name of the field in the Selected Custom Fields box, and then click Remove to move it to the Available Custom Fields box.
|
7. | Click Edit Template,
and the template opens in Excel or Visio. Use the features in the
application to surface the data you added or to rearrange the report to
account for the data you removed.
|
If the existing reports
don’t come anywhere near meeting your needs, you can create your own
report by choosing what format you want to use and what data you want to
export.
To create a new visual report template, follow these steps:
1. | On the Project tab, in the Reports group, click Visual Reports.
|
2. | Click New Template.
|
3. | Under Select Application, choose whether you want to create the report in Excel or Visio.
|
4. | Under Select Data Type, choose a category of usage or summary data that includes the information you want in your report.
|
5. | Under Select Fields, click Field Picker.
|
6. | To add a built-in Project field to the report, under Select Fields, click the name of the field in the Available Fields box, and then click Add to move it to the Selected Fields box.
|
7. | To remove a built-in Project field from the report, under Select Fields, click the name of the field in the Selected Fields box, and then click Remove to move it to the Available Fields box.
|
8. | To add a custom field to the report, under Select Custom Fields, click the name of the field in the Available Custom Fields box, and then click Add to move it to the Selected Custom Fields box.
|
9. | To remove a custom field from the report, under Select Custom Fields, click the name of the field in the Selected Custom Fields box, and then click Remove to move it to the Available Custom Fields box.
|
10. | Click OK on the Visual Reports—Field Picker dialog box to add the selected fields to the report.
|
11. | Click OK on the Visual Reports—New Template
dialog box to export the data to Excel or Visio and begin designing the
visual layout of your report. Use the PivotTable and PivotChart
features in those applications to choose how you want to present your
project data. |
