The Performance Monitor
utility is used to measure the performance of a local or a remote
computer on the network. Performance Monitor enables you to do the
following:
Collect data from
your local computer or remote computers on the network. You can collect
data from a single computer or multiple computers concurrently.
View data as it is being collected in real time, or historically from collected data.
Have
full control over the selection of what data will be collected, by
selecting which specific objects and counters will be collected.
Choose
the sampling parameters that will be used, meaning the time interval
that you want to use for collecting data points and the time period that
will be used for data collection.
Determine the format in which data will be viewed—in line, histogram bar, or report views.
Create HTML pages for viewing data.
Create specific configurations for monitoring data that can then be exported to other computers for performance monitoring.
NOTE
In order to view data on
remote computers, you need to have administrative rights to the remote
computer, and the Remote Registry Service must be enabled and running on
the remote computer. Also, make sure your firewall allows the ability
to remote in.
Windows 7 Performance Monitor includes the new data collector set.
This tool works with performance logs, telling Performance Monitor
where the logs are stored and when the log needs to run. The data
collector sets also define the credentials used to run the set.
Data collector sets are used
to collect data into a log so that the data can be reviewed. You can
view the log files with Performance Monitor, as described in the
previous section.
Data collector sets can collect the following data:
Windows 7 includes the following four data collector sets that are stored within the System subfolder:
LAN Diagnostics
System Diagnostics
System Performance
Wireless Diagnostics
Through Performance Monitor,
you can view current data or data from a log file. When you view current
data, you are monitoring real-time activity. When you view data from a
log file, you are importing a log file from a previous session.
To access Performance Monitor, choose Start => Control Panel => System and Security => Administrative Tools => Performance Monitor (double-click), or type perfume from the Windows 7 search box. Figure 1 shows the main Performance Monitor window when it is initially opened without configuration.
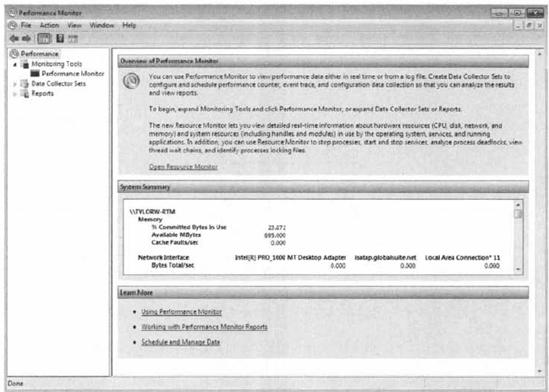
When you first
start Performance Monitor, the Overview Of Performance Monitor page is
displayed. The System Summary pane of this page gives a quick snapshot
of which resources are being used in your computer. Notice the four
initial resources tracked: Memory, Network Interface, Physical Disk, and
Processor Information, You can view detailed information about each
resource by choosing the Open Resource Monitor link or by typing perfmon
from the Windows 7 search box.
1. Using Resource Monitor
The Resource Monitor
window was integrated into the Reliability and Performance utility of
Windows Vista, but has been given its own dialog box in Windows 7. Figure 2 shows the Resource Monitor tabbed dialog box.
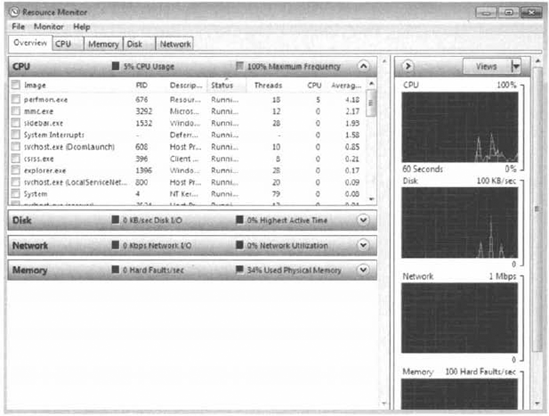
The Overview tab of the Resource
Monitor dialog box is open by default and gives you a fair amount of
detail in terms of a graphical representation on the right side. The
main window of the Resource Monitor dialog box gives you an overview of
the four major subsystems monitored by default (CPU, Disk, Network, and
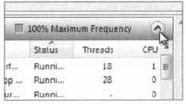
Memory). You expand or compress each of the four items by clicking the
arrow in the right of the item title bar, as shown in Figure 3.
For example, if you want to view details about the memory being used by
the processes of Windows 7, click the arrow to expand Memory, and you
can view each process, process ID, and memory allocation by physical,
shared, and private allotment.
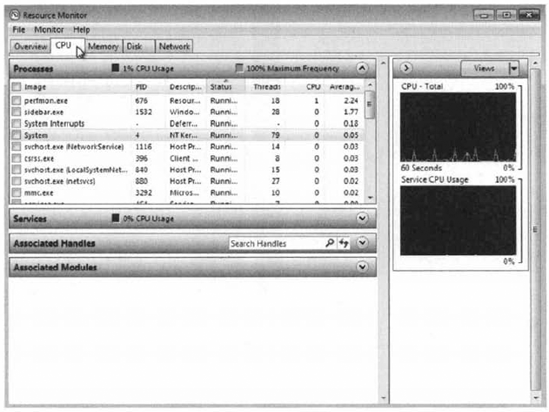
The other tabs of
Resource Monitor give detailed information with regard to each of the
major subsystems of Windows 7. The CPU tab of Resource Monitor displays
the individual process currently running on the machine as well as the
process ID (PID), a brief description, the running status of the
process, the number of threads the process is running, current CPU
utilization, and average CPU utilization. You also have services
details, application handle details, and module derails available by
expanding each item. The CPU tab of Resource Monitor is shown in Figure 4.
The right side of the CPU tab also offers a graphical representation of
real-time statistics indicating percentages for CPU total usage and
service CPU usage.
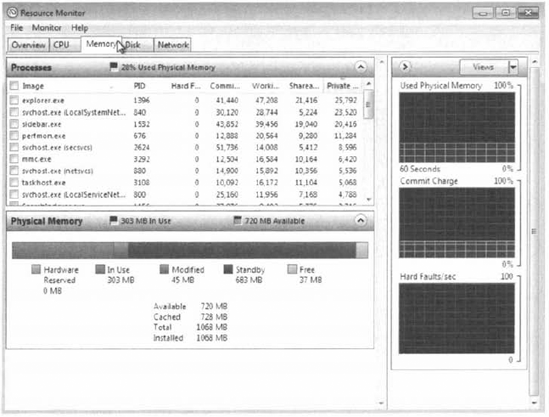
The Memory tab of Resource
Monitor shows the process information as displayed in the CPU tab, with
an overview of memory allocarion in the form of a graphical
representation. The right side of the display also shows you real-time
information about the physical memory, currently allocated memory called
the Commit Charge, and Hard Faults/Sec (the number of memory accesses
that are not actually in RAM, but in a page file waiting to be used).
The Memory tab of Resource Monitor is shown in Figure 5.
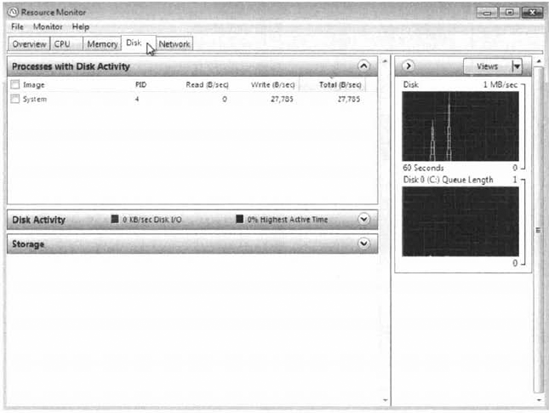
The Disk tab of
Resource Monitor is used to display the disk activity of your machine.
The items available to view are the Processes With Disk Activity, Disk
Activity, and Storage statistics. You can see the Disk tab in Figure 6,
including the real-time graphical representation of Disk transfer in
KB/sec and Disk Queue Length (the amount of transfer currently waiting
for transfer to RAM for processing).
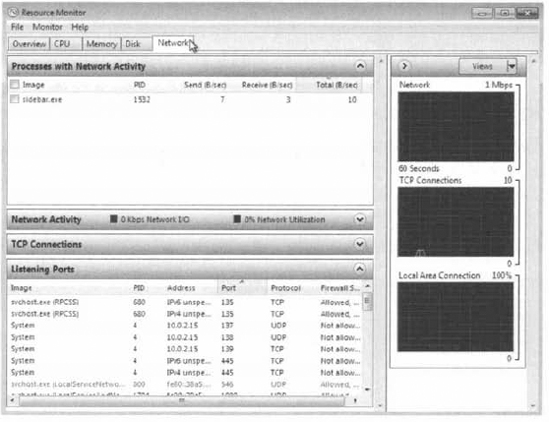
The Network tab of Resource
Monitor shows network utilization as well as network protocol
information. The items available for detailed information include
Processes With Network Activity, Network Activity, TCP Connections, and
Listening Ports. We've had this information available to us in previous
versions of Windows, but this is one convenient location for a slew of
useful network information. As shown in Figure 7,
the Network tab offers a huge amount of useful network information (I
have opened the Listening Ports item in the figure) as well as the
real-time graphical information for Network data transfer, open TCP
Connections, and Local Area Connection usage as a percentage.
It is important to
monitor resources such as hard drive cache and network performance.
Monitoring these resources enables you to configure them for peak
performance in Windows 7.
For monitoring system
activity other than what is provided by the Resource Overview tab and
Resource Monitor, you must use more of the Performance Monitor features.
