4. Managing Performance Monitor Data with Collector Sets
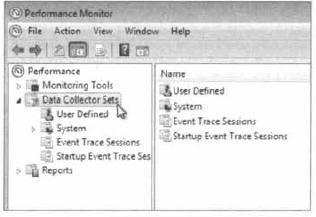
The data collector set portion of Performance Monitor is shown in Figure 17. Data collector sets
are used to collect data into a log so that the data can be reviewed
and saved for comparison at a later date (baselining). You can view the
log files with Performance Monitor, as described in the previous
section, "Managing Performance Monitor Properies" (in the "Source Tab"
subsection).
Data collector sets can collect the following data:
There are two
built-in data collector sets that track multiple counters for system
diagnostics and system performance. You can also create your own
user-defined data collector sets and save them for later use. You can
view the reports from these data collector sets within the Reports
folder in Performance Monitor.
Performance counter logs
record data about hardware usage and the activity of system services.
You can configure logging to occur manually or on a predefined schedule.
Perform Exercise 2 to create a data log.
Expand Data Collector Sets and right-click User Defined. Select New and then select Data Collector Set from the pop-up menu. In
the Create New Data Collector Set dialog box that appears, type a name
for the collector set and choose whether to create the set from a
template or to create it manually; then click the Next button. If
you chose to create the set from a template, follow the prompts to
create the set. After the set is created, you can modify it. If you
chose to create the set manually, you are asked whether you want to
create data logs or a performance counter alert. Data logs can consist
of the following types of data: Add the performance counters you want to collect and click Next after each data type. You are asked where to save the data. Browse to the location, click OK, and then click Next. You
are asked under which user account the data collector set should run,
and whether the data collector set should be edited, started, or saved.
After you make your selections, click Finish.
|
4.1. Creating an Alert
Alerts can be generated
when a specific counter rises above or falls below a specified value.
You can configure alerts to log an entry in the application event log
and/or start a data collector set. Creating an alert is similar to
creating a performance counter data log except you are required to
specify the alert conditions. You create an alert by creating a
user-defined collector set, manually specifying counters. In the Create
New Data Collector Wizard, you have the option of selecting a
Performance Counter Alert radio button. For example, you might configure
a performance counter alert that will log an entry whenever the % Free
Space counter for C: falls below 5 percent. After you create the alert,
you can modify the alert parameters by right-clicking the data collector
and selecting Properties.
After you create the data
collector sets and set the alerts, you will want to run the sets and
save the logs periodically. Reviewing the logs gives you a proactive
approach to managing your Windows 7 performance.
Now let's take a look at how to manage Windows 7 performance.
5. Managing System Performance
By analyzing data,
you can determine whether any resources are placing an excessive load on
your computer, resulting in a system slowdown. The following list gives
some of the causes of poor system performance:
A resource is
insufficient to handle the load that is being placed upon it, and the
component might need to be upgraded, or additional components might be
required.
If a
resource has multiple instances, the resources might not be evenly
balancing the workload, and the workload might need to be balanced over
the multiple instances more effectively.
A resource might be malfunctioning. In this case, the resource should be repaired or replaced.
A
specific program might be allocating resources improperly or
inefficiently, in which case the program needs to be rewritten or
another application should be used.
A resource might be configured improperly and causing excessive resource usage, and need to be reconfigured.
There are four main
subsystems that you should monitor. You should configure counters in
your data collector set for each of the following:
The memory subsystem
Theprocessorsubsystem
The disk subsystem
The network subsystem
Each subsystem should be examined over time to evaluate Windows 7 performance.
5.1. Monitoring and Optimizing Memory
When the operating system
needs a program or process, the first place it looks is in physical
memory. If the required program or process is not in physical memory,
the system looks in logical memory (the page file). If the program or
process is not in logical memory, the system then must retrieve the
program or process from the hard disk. It can take thousands of times
longer to access information from the hard disk than to get it from
physical RAM. If your computer is using excessive paging, that is an
indication that your computer does not have enough physical memory.
Insufficient memory is the
most likely cause of system bottlenecks. If you have no idea what is
causing a system bottleneck, memory is usually a good place to start
checking. To determine how memory is being used, you need to examine the
following two areas:
Physical Memory
The physical RAM you have installed on your computer. You should have
as much memory as either your machine or budget can handle. It's
actually a good idea to have more memory than you think you will need
just to be on the safe side. As you've probably noticed, each time you
add or upgrade applications, you require more system memory.
Page File Logical memory
exists on your hard drive. If you are using excessive paging (swapping
between the page file and physical RAM) or hard page faults, it's a
clear sign that you need to add more memory.
The first step in memory
management is determining how much memory your computer has installed
and what the appropriate memory requirements are based on the operating
system requirements and the applications and services you are running on
your computer.
5.2. Key Counters to Track for Memory Management
The following three counters are the three most important counters for monitoring memory:
Memory => Available Mbytes Memory =>
Available MBytes measures the amount of physical memory that is
available to run processes on the computer. If this number is less than
20 percent of your installed memory, it indicates that you might have an
overall shortage of physical memory for your computer, or you possibly
have an application that is not releasing memory properly. You should
consider adding more memory or evaluating application memory usage.
Memory => Pages/Sec Memory =>
Pages/Sec shows the number of times the requested information was not
in memory and had to be retrieved from disk. This counter's value should
be below 20; for optimal performance, it should be 4 or 5. If the
number is above 20, you should add memory or research paging file use
more thoroughly. Sometimes a high Pages/Sec counter is indicative of a
program that is using a memory-mapped file.
Paging File => % Usage Paging File =>
% Usage indicates the percentage of the allocated page file that is
currently in use. If this number is consistently over 70 percent, you
might need to add more memory or increase the size of the page file. You
should track this counter in conjunction with Available MBytes and
Pages/Sec.
The counters listed previously work together to show what is happening on your system. Use the Paging File => % Usage counter value in conjunction with the Memory => Available MBytes and Memory => Pages/Sec counters to determine how much paging is occurring on your computer.
Along with memory counters, processor (or CPU) counters are valuable in evaluating Windows 7 performance.
5.3. Managing Processor Performance
Processor
bottlenecks can develop when the threads of a process require more
processing cycles than are currently available. In this case, the
process will wait in a processor queue, and system responsiveness will
be slower than if process requests could be immediately served. The most
common causes of processor bottlenecks are processor-intensive
applications and other subsystem components that generate excessive
processor interrupts (for example, disk or network subsystems).
In a workstation
environment, processors are usually not the source of bottlenecks.
However, you should still monitor this subsystem to make sure that
processor utilization is at an efficient level.
Let's now take a look at some of the key counters that you need to track when watching the processor.
5.4. Key Counters to Track for the Processor
You can track
processor utilization through the Processor and System objects to
determine whether a processor bottleneck exists. The following three
counters are the most important counters for monitoring the system
processor:
Processor => % Processor Time Processor => %
Processor Time measures the time that the processor spends responding
to sysrem requests. If this value is consistently above an average of 85
percent, you might have a processor bottleneck. The Processor => % User Time and Processor =>
% Privileged Time counters combine to show the total % Processor Time
counter. You can monitor these counters individually for more detail.
Processor => Interrupts/Sec Processor =>
Interrupts/Sec shows the average number of hardware interrupts received
by the processor each second. If this value is more than 3,000, you
might have a problem with a program or hardware that is generating
spurious interrupts. (This value will vary in optimization based on the
processor type; you'll need to do a little research for your specific
processor to see the appropriate value.)
System => Processor Queue Length System =>
Processor Queue Length is used to determine whether a processor
bottleneck is due to high levels of demand for processor time. If a
queue of two or more items exists for an extended period of time, a
processor bottleneck might be indicated. If you suspect that a processor
bottleneck is due to excessive hardware I/O requests, then you should
also monitor the System => File Control Bytes/Sec counter.
5.5. Tuning and Upgrading the Processor
If you suspect that you have a processor bottleneck, you can try the following solutions:
Use applications that are less processor-intensive.
Upgrade your processor.
If your computer supports multiple processors, add one.
The Memory and
Processor subsystem objects are important counters to evaluate in
determining your Windows 7 performance. You should also look at the hard
drive or disk subsystem to check for issues as well.
6. Managing the Disk Subsystem
Disk access
is the amount of time your disk subsystem takes to retrieve data that
is requested by the operating system. The two factors that determine how
quickly your disk subsystem will respond to system requests are the
average disk access time on your hard drive and the speed of your disk
controller.
6.1. Key Counters to Track for the Disk Subsystem
You can monitor the
PhysicalDisk object, which is the sum of all logical drives on a single
physical drive, or you can monitor the LogicalDisk object, which
represents a specific logical disk. The more important counters for
monitoring the disk subsystem are as follows:
PhysicalDisk => % Disk Time and LogicalDisk => % Disk Time PhysicalDisk => % Disk Time and LogicalDisk =>
% Disk Time show the amount of time the disk is busy because it is
servicing read or write requests. If your disk is busy more than 90
percent of the time, you will improve performance by adding another disk
channel and splitting the disk I/O requests between the channels.
PhysicalDisk => Current Disk Queue Length and LogicalDisk => Current Disk Queue Length PhysicalDisk => Current Disk Queue Length and LogicalDisk =>
Current Disk Queue Length indicate the number of outstanding disk
requests that are waiting to be processed. On average, this value should
be less than 2.
LogicalDisk => % Free Space LogicalDisk => % Free Space specifies how much free disk space is available. This counter should indicate at least 15 percent.
6.2. Tuning and Upgrading the Disk Subsystem
When you suspect that you have
a disk subsystem bottleneck, the first thing you should check is your
memory subsystem. Insufficient physical memory can cause excessive
paging, which in turn affects the disk subsystem.
If you do not have a memory problem, try the following solutions to improve disk performance:
Use faster disks and controllers.
Confirm that you have the latest drivers for your disk adapters.
Use disk striping to take advantage of multiple I/O channels.
Balance heavily used files on multiple I/O channels.
Add another disk controller for load balancing.
Use Disk Defragmenter to consolidate files so that disk space and data access are optimized.
After you evaluate the
first three subsystems—memory, processor, and disk—you also need to look
at the network subsystem to optimize your Windows 7 performance.
7. Optimizing the Network Subsystem
Windows 7 does not have a
built-in mechanism for monitoring the entire network. However, you can
monitor and optimize the traffic that is generated on your Windows 7
machine. You can monitor the network interface (your network card) and
the network protocols that have been installed on your computer.
Network bottlenecks are
indicated when network traffic exceeds the capacity that can be
supported by the local area network (LAN). Typically, you would monitor
this activity on a network-wide basis—for example, with the Network
Monitor utility that ships with Windows Server 2003.
7.1. Key Counters to Track for the Network Subsystem
If you are using the
Performance Monitor utility to monitor local network traffic, the
following two counters are useful for monitoring the network subsystem:
Network Interface => Bytes Total/Sec Network Interface =>
Bytes Total/Sec measures the total number of bytes sent or received
from the network interface and includes all network prorocols.
TCPv4 => Segments/Sec TCPv4 => Segments/Sec measures the number of bytes sent or received from the network interface and includes only the TCPv4 prorocol.
7.2. Tuning and Upgrading the Network Subsystem
You can use the following guidelines to help optimize and minimize network traffic:
Install and configure only the network protocols you need.
Use network cards that take advantage of your bus speed.
Use faster network cards—for example, 100 Mbps Ethernet or 1 Gbps Ethernet instead of 10 Mbps Ethernet.
A feature was added to
Windows Vista as part of Performance Monitor known as Reliability
Monitor (hence the Windows Vista tool named Reliability and Performance Monitor). In Windows 7, Microsoft removed the tool from Performance Monitor and added Reliability Monitor as its own tool.
