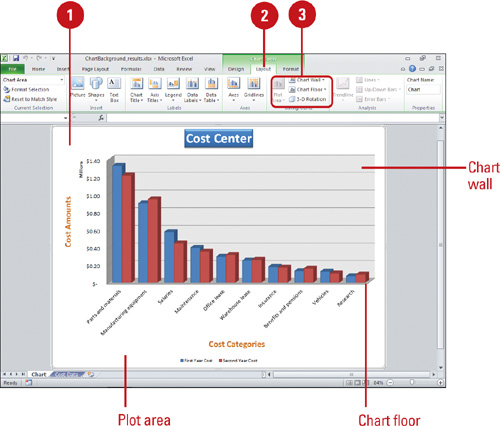
Changing the Chart Background
Format
the background of a chart by showing or hiding the chart wall or floor
with a default color fill, or by changing the 3-D view of a chart. The plot area is bounded by the axes, which includes all data series. The chart wall is the background, and the chart floor
is the bottom in a 3-D chart. The 3-D view allows you to change the
rotation of a 3-D chart using the x-, y-, or z-axis, and apply a 3-D
perspective to the chart.
Change the Chart Background
 Select the chart element you want to modify.
 Click the Layout tab under Chart Tools.
 Click any of the following buttons:
- Plot Area to show or hide the plot area.
- Chart Wall to show or hide the chart wall with the default color fill.
- Chart Floor to show or hide the chart floor with the default color fill.
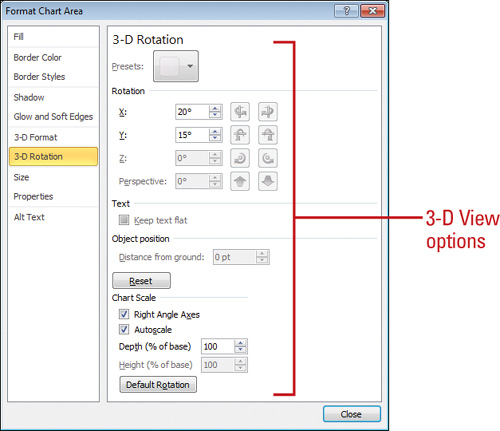
- 3-D Rotation to change the 3-D viewpoint of the chart.
In the Format Chart Area dialog box, click 3-D Rotation or 3-D Format in
the left pane, select the 3-D options you want, and then click Close.
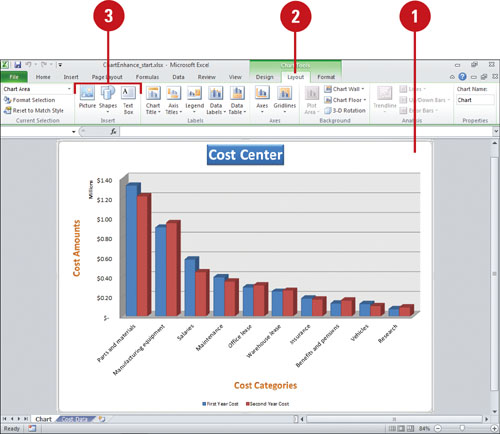
Enhancing a Chart
If
you want to further enhance a chart, you can insert a picture, shape or
text annotation to add visual appeal. In the same way you insert a
picture, shape, or text box into a worksheet, you can insert them into a
chart. The Picture, Shapes, and Text Box button are available on the
Layout tab under Chart Tools.
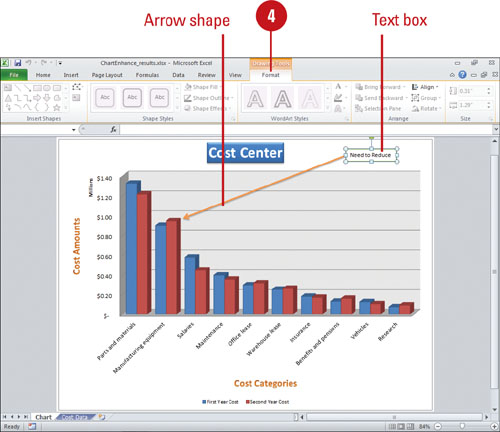
Insert a Picture, Shape, or Text
- Select the chart element you want to modify.
- Click the Layout tab under Chart Tools.
- Use any of the following:
- Picture. Click the Picture button, select a picture, and then click Insert.
- Shapes. Click the Shapes button, click a shape, and then drag to draw the shape.
- Text Box. Click the Text Box button, drag to create a text box, and then type the text you want.
 Use the Format tab under Drawing Tools to format the shape or text box.
You can edit shape text. Right-click the shape or text object, click Edit Text, modify the text, and then click outside the object to deselect it.
You can convert a chart to a picture.
Select the chart, click the Home tab, click the Copy button, click the
Paste button arrow, point to As Picture, and then click Paste As
Picture. Instead of using Paste As Picture, you can use Paste Special to
paste a chart as a picture with a specific graphic format, such as PNG,
JPEG, GIF, Enhanced Metafile, or Bitmap.
