Understanding Chart Terminology
Choosing the Right Type of Chart
When
you create a chart in Excel, you can choose from a variety of chart
types. Each type interprets data in a slightly different way. For
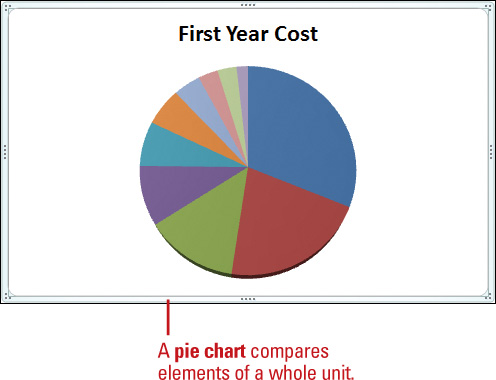
example, a pie chart is great for comparing parts of a whole, such as
regional percentages of a sales total, while a column chart is better
for showing how different sales regions performed throughout a year.
Although there is some overlap, each chart type is best suited for
conveying a different type of information.
When you generate a chart, you
need to evaluate whether the chart type suits the data being plotted,
and whether the formatting choices clarify or overshadow the
information. Sometimes a colorful 3-D chart is just what you need to
draw attention to an important shift; other times, special visual
effects might be a distraction.
Creating a Chart
A chart
provides a visual, graphical representation of numerical data. Charts
add visual interest and useful information represented by lines, bars,
pie slices, or other markers. A group of data values from a worksheet
row or column of data makes up a data series.
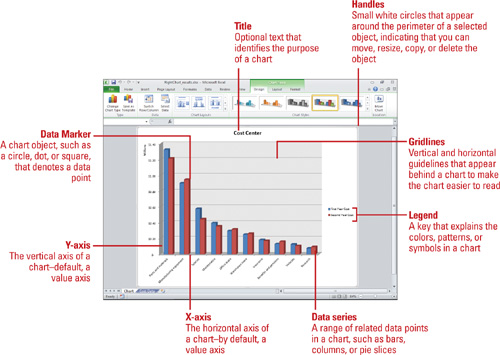
Each data series has a unique color or pattern on the chart. Titles on
the chart, horizontal (x-axis), and vertical (y-axis) identify the data.
Gridlines are horizontal and vertical lines to help the reader
determine data values in a chart. When you choose to place the chart on
an existing sheet, rather than on a new sheet, the chart is called an embedded object. You can then resize or move it just as you would any graphic object.
Insert and Create a Chart
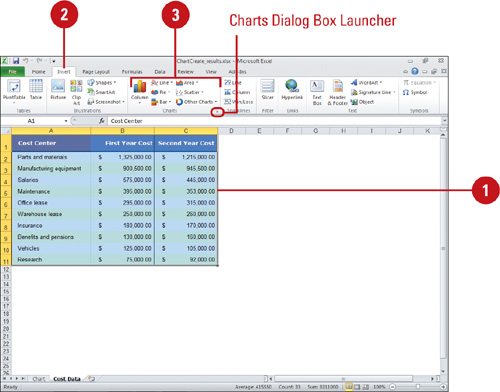
 Select the data you want to use to create a chart.
 Click the Insert tab.
 Use one of the following methods:
- Basic Chart Types. Click a
chart button (Column, Line, Pie, Bar, Area, Scatter, Other Charts) in
the Charts group, and then click the chart type you want.
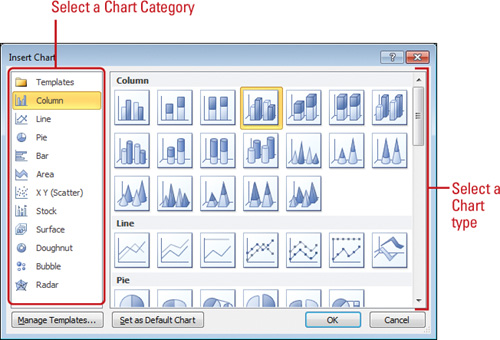
- All Chart Types. Click the Charts Dialog Box Launcher, click a category in the left pane, click a chart, and then click OK.
A chart appears on the worksheet as an embedded chart.
Embedded charts are beneficial.
A chart sheet is beneficial when you want to view or print a chart or
PivotChart report separately from worksheet data or a PivotTable report.
Move a Chart to Another Worksheet
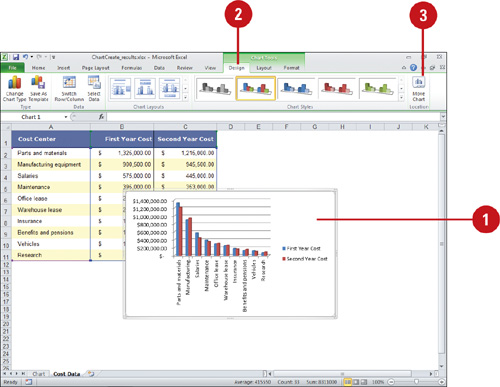
- Click the chart you want to modify.
- Click the Design tab under Chart Tools.
- Click the Move Chart button.
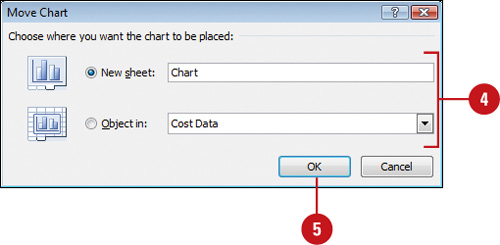
 Use one of the following methods:
- To move the chart to a chart sheet, click the New sheet option, and then type a new name for the chart tab.
- To move the chart to another worksheet as an embedded object, click the Object in option, and then select the worksheet you want.
 Click OK.
You can quickly create a default chart.
Select the data you want to use for the chart, and then press F11 to
create a chart on a new sheet, or press Alt+F1 to create an embedded
chart on the active worksheet.
You can set the default chart.
In the Insert Chart dialog box, select the chart type and chart subtype
you want to set as the default, and then click Set As Default Chart.
You can edit the contents of chart text.
To edit the contents of a title, click the chart or axis title. To edit
the contents of a data label, double-click the data label. Click to
place the insertion, and then make changes.
