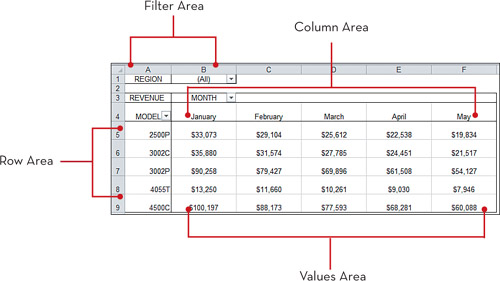
The Anatomy of a Pivot Table
Creating a Pivot Table
Before
you create a pivot table, you should ask yourself two questions; “What
am I measuring?” and “How do I want to see it?” The answer to these
questions gives you some guidance when determining which areas you will
place your data fields.
In this scenario, we want to
see dollar sales by market. This means we need a Sales field and a
Market field. How do you want to see that? We want markets to go down
the left side of the report and dollar sales to be calculated next to
each market.
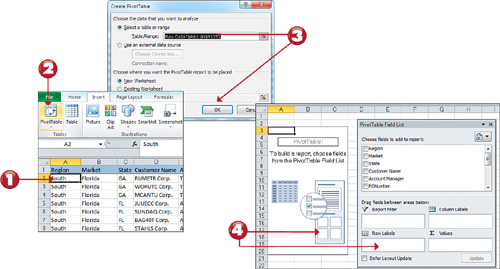
1. Click any single cell inside your data table.
2. Select the Insert tab in the Ribbon, and then click the PivotTable command.
3. This activates the Create PivotTable dialog box. Specify the location of your source data, and then click the OK button.
4.
Observe that you have an empty pivot table report on a new worksheet.
Next to the pivot table, you will see the PivotTable Field List.
Note: Pivot Table Default Location
Note
that in the Create PivotTable dialog box, the default location for a new
pivot table is New Worksheet. You can change this by selecting the
Existing Worksheet option and specifying the worksheet where you want
the pivot table placed. |
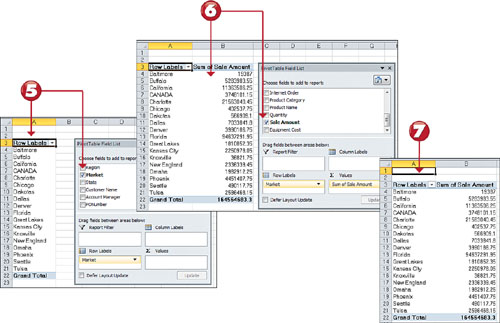
5. Find the Market
field in field selector and place a check next to it. Note that the
Market field is automatically placed in the Row area of the pivot table.
6. Scroll down the PivotTable Field List and find the Sales Amount field. Place a check next to it and note the Sales Amount field is automatically placed in the Values area.
7. Click off your pivot table to make the PivotTable Field List disappear. Observe your first pivot table.
Note: How Excel Knows where to Place Data
Placing a
check next to any field that is non-numeric (text or date)
automatically places that field into the row area of the pivot table.
Placing a check next to any field that is numeric automatically places
that field in the values area of the pivot table. |
Tip: Activating the PivotTable Field List
The
PivotTable Field List typically activates when you click anywhere on
your pivot table. If clicking the pivot table doesn’t activate the
PivotTable Field List dialog box, you can manually activate it by
right-clicking anywhere inside the pivot table and selecting Show Field
List. |
Rearranging a Pivot Table
The
nifty thing about pivot tables is that you can add as many layers of
analysis as made possible by the fields in your source data table. For
instance, if we wanted to show the dollar sales each market earned by
product category, we could simply drag the Product Category field to the
Column area.
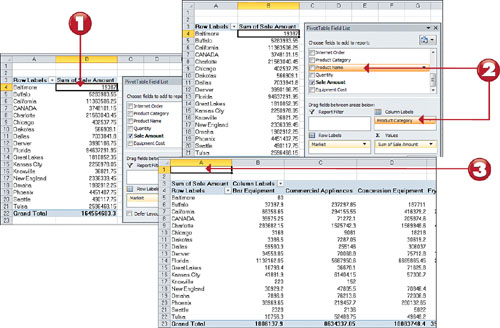
1. Click anywhere on your pivot table to reactivate the PivotTable Field List.
2. Find the Product Category field, click it and drag it to the Column area in the Pivot Table Field List.
3.
Click off your pivot table to make the PivotTable Field List disappear,
and note how your pivot table now shows a matrix style view.
Tip: Dragging Fields from One Area to Another
You’re
not limited to only dragging fields from the field list. You can drag
fields from one area to another. For example, you can drag the product
category field from the column area to the row area. This is a fairly
powerful benefit in that it lets you experiment with the look and feel
of your pivot table reports. |
