A legend
is a set of text labels that helps the reader connect the colors and
patterns in a chart with the data they represent. Legend text is derived
from the data series plotted within a chart. You can rename an item
within a legend by changing the text in the data series. If the legend
chart location doesn’t work with the chart type, you can reposition the
legend at the right, left, top or bottom of the chart or overlay the
legend on top of the chart on the right or left side. Data labels
show data values in the chart to make it easier for the reader to see,
while a Data table shows the data values in an associated table next to
the chart. If you want a customized look, you can set individual options
using the Format dialog box.
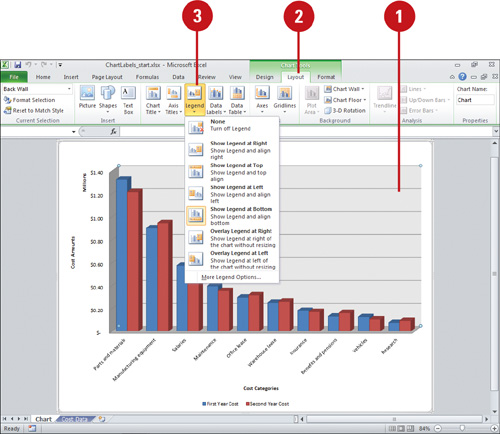
Change the Chart Legend
 Select the chart you want to modify. Select the chart you want to modify.
 Click the Layout tab under Chart Tools. Click the Layout tab under Chart Tools.
 Click the Legend button, and then click one of the following: Click the Legend button, and then click one of the following:
- None to hide the legend.
- Show Legend at Right to display and align the legend on the right.
- Show Legend at Top to display and align the legend at the top.
- Show Legend at Left to display and align the legend on the left.
- Show Legend at Bottom to display and align the legend at the bottom.
- Overlay Legend at Right to position the legend on the chart on the right.
- Overlay Legend at Left to position the legend on the chart on the left.
- More Legend Options to set custom legend options.
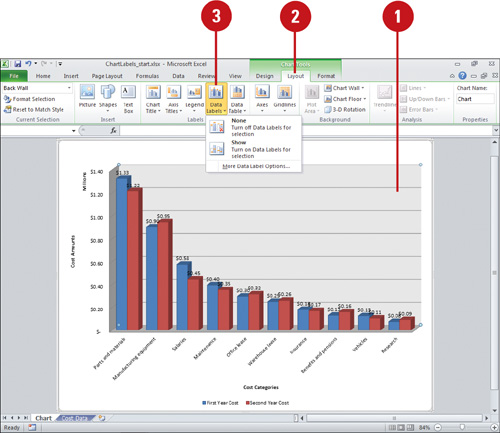
Change Chart Data Labels
- Select the chart you want to modify.
- Click the Layout tab under Chart Tools.
- Click the Data Labels button, and then click one of the following:
- None to hide data labels.
- Show to display data labels centered on the data points.
- More Data Label Options to set custom data label options.
The available options vary depending on the select chart.
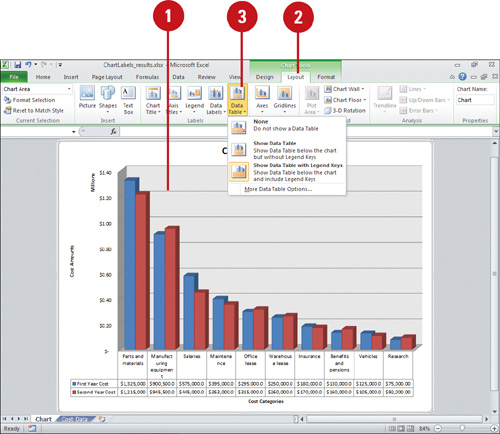
Show or Hide a Chart Data Table
- Select the chart you want to modify.
- Click the Layout tab under Chart Tools.
- Click the Data Table button, and then click one of the following:
- None to hide a data table.
- Show Data Table to show the data table below the chart.
- Show Data Table with Legend Keys to show the data table below the chart with legend keys.
- More Data Table Options to set custom data table options.
|
