Logo
programming4us
programming4us
programming4us
programming4us
Home
programming4us
XP
programming4us
Windows Vista
programming4us
Windows 7
programming4us
Windows Azure
programming4us
Windows Server
programming4us
Windows Phone
 
Windows Server

SharePoint 2010 PerformancePoint Services : Examining Decomposition Tree Reports

- Free product key for windows 10
- Free Product Key for Microsoft office 365
- Malwarebytes Premium 3.7.1 Serial Keys (LifeTime) 2019
4/9/2011 4:38:08 PM
The decomposition tree (decomp tree) report enables you to visualize how child hierarchy members contribute to a parent. This is most useful when trying to understand the underlying data for a particular value. With the decomp tree, you can “decompose” the parent value into its constituent values and view them broken out by dimensions.

Note

Although this report is automatic in the analytic report types, some configuration is necessary to make this report available on a scorecard. The calculation for the KPI row needs to be set to Source Data. If the KPI row on the scorecard is configured in this way, the Show Details option will appear when you right-click the data cell.


The decomp tree report is only accessible from a context menu and will not show up with other report types in Dashboard Designer,

To access the context menu, begin with the Viewers and Potential Viewers Analytic Chart for Season 1, as shown in Figure 1. The high point in the graph is the data point for “episode 109. You can see more information about why this particular show was more successful than the other shows. To do this, right-click the point, and then select Decomposition Tree from the context menu that appears.

Figure 1. The Decomposition Tree option is available from the context menu on analytical charts, grids, or scorecards.

The decomp tree for this episode appears first with only “episode 109 (see Figure 2). To drill down and find out which region had the most viewers, left-click the 109 element, and then select Affiliate—Region. From here, it is possible to continue drilling down through to the Affiliate city and then into the Calendar to see the month. Eventually, you will locate the day with the highest number of viewers.
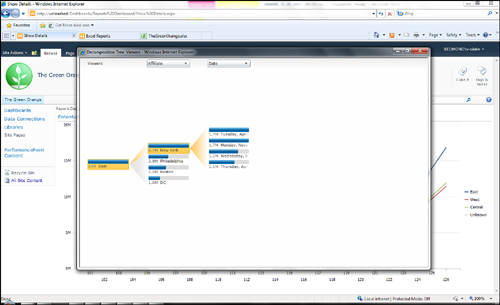
Figure 2. Browse the decomp tree for detail information.


Other -----------------
- SharePoint 2010 PerformancePoint Services : Reports - Strategy Map
- Windows Server 2008 R2 : Installing DFS (part 2) - Creating a DFS Folder and Replication Group & Configuring DFS Read-Only Replication
- Windows Server 2008 R2 : Installing DFS (part 1) - Creating the DFS Namespace and Root & Adding an Additional Namespace Server to a Domain-Based Namespace
- Windows Server 2008 R2 : File System Management and Fault Tolerance - Planning a DFS Deployment
- Windows Server 2008 R2 : File System Management and Fault Tolerance - The Distributed File System
- Windows Server 2003 : Creating Role-Specific Server Configurations (part 2) - Securing Infrastructure Servers & Securing File and Print Servers
- Windows Server 2003 : Creating Role-Specific Server Configurations (part 1) - Securing Domain Controllers
- Exchange Server 2010 Management and Maintenance Practices : The Exchange Control Panel
- Exchange Server 2010 Management and Maintenance Practices : Maintenance Tools for Exchange Server 2010
- Exchange Server 2010 Management and Maintenance Practices : Proper Care and Feeding of Exchange Server 2010
 
 
Top 10
- Microsoft Visio 2013 : Adding Structure to Your Diagrams - Finding containers and lists in Visio (part 2) - Wireframes,Legends
- Microsoft Visio 2013 : Adding Structure to Your Diagrams - Finding containers and lists in Visio (part 1) - Swimlanes
- Microsoft Visio 2013 : Adding Structure to Your Diagrams - Formatting and sizing lists
- Microsoft Visio 2013 : Adding Structure to Your Diagrams - Adding shapes to lists
- Microsoft Visio 2013 : Adding Structure to Your Diagrams - Sizing containers
- Microsoft Access 2010 : Control Properties and Why to Use Them (part 3) - The Other Properties of a Control
- Microsoft Access 2010 : Control Properties and Why to Use Them (part 2) - The Data Properties of a Control
- Microsoft Access 2010 : Control Properties and Why to Use Them (part 1) - The Format Properties of a Control
- Microsoft Access 2010 : Form Properties and Why Should You Use Them - Working with the Properties Window
- Microsoft Visio 2013 : Using the Organization Chart Wizard with new data
 
programming4us
Windows Vista
programming4us
Windows 7
programming4us
Windows Azure
programming4us
Windows Server