Summarizing Data Using SubtotalsIf you have a column list with similar facts and no
blanks, you can automatically calculate subtotals and grand totals in a
list. Subtotals are calculated with a summary function, such as SUM,
COUNT, or AVERAGE, while Grand totals are created from detailed data
instead of subtotal values. Detailed data
is typically adjacent to and either above or below or to the left of
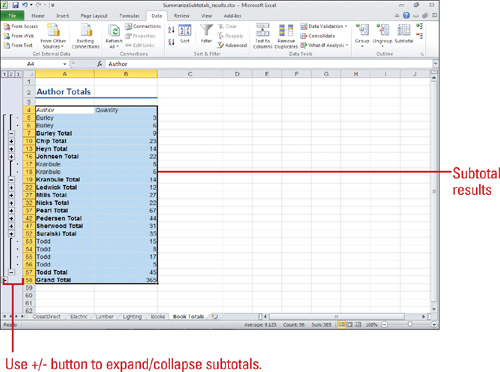
the summary data. When you summarize data using subtotals, the data list
is also outlined to display and hide the detailed rows for each
subtotal.
Subtotal Data in a List
 Organize data in a hierarchical fashion—place summary rows below detail
rows and summary columns to the right of detail columns.
Organize data in a hierarchical fashion—place summary rows below detail
rows and summary columns to the right of detail columns.
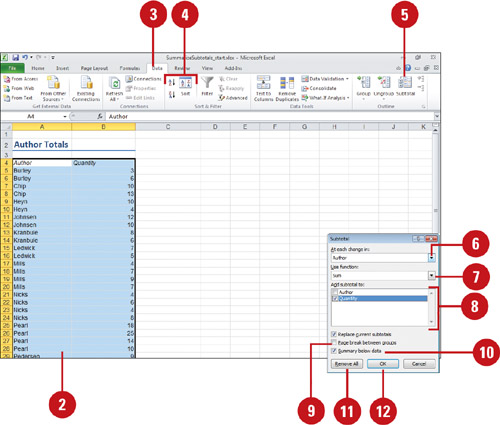
 Select the data that you want to subtotal. Select the data that you want to subtotal.
 Click the Data tab. Click the Data tab.
 Use sort buttons to sort the column. Use sort buttons to sort the column.
 Click the Subtotal button. Click the Subtotal button.
 Click the column to subtotal. Click the column to subtotal.
 Click the summary function you want to use to calculate the subtotals. Click the summary function you want to use to calculate the subtotals.
 Select the check box for each column that contains values you want to subtotal. Select the check box for each column that contains values you want to subtotal.
 To set automatic page breaks following each subtotal, select the Page break between groups check box. To set automatic page breaks following each subtotal, select the Page break between groups check box.
 To show or hide a summary row above the detail row, select or clear the Summary below data check box. To show or hide a summary row above the detail row, select or clear the Summary below data check box.
 To remove subtotals, click Remove All. To remove subtotals, click Remove All.
 Click OK. Click OK.
  To add more subtotals, use the Subtotal button again. To add more subtotals, use the Subtotal button again.
Summarizing Data Using Functions
You
can use conditional functions, such as SUMIF, COUNTIF, and AVERAGEIF to
summarize data in a workbook. These functions allow you to calculate a
total, count the number of items, and average a set of numbers based on a
specific criteria. You can use the SUMIF function to add up interest
payment for accounts over $100, or use the COUNTIF function to find the
number of people who live in CA from an address list. If you need to
perform these functions based on multiple criteria, you can use the
SUMIFS, COUNTIFS, and AVERAGEIFS functions. If you need to find the
minimum or maximum in a range, you can use the summarizing functions MIN
and MAX.
Use Summarize Data Functions
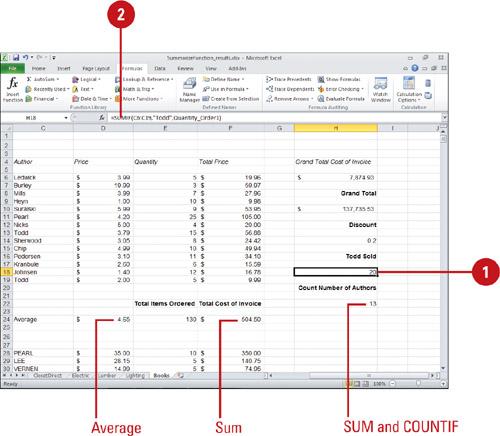
- Click the cell where you want to place the function.
- Type = (equal sign), type a text function, specify the argument for the selected function, and then press Enter.
Some examples include:
- =AVERAGE(D6:D19)
- ={=SUM(1/COUNTIF(C6:C19, C6:19))}
- =SUMIF(C6:C19,“Todd”, Quantity_Order1)
- =SUM(Quantity_Order1)
Or click the Formulas tab, click the Math & Trig button or click the More Functions button and point to Statistical, click a data function, specify the function arguments, and then click OK.
You can use several functions to count items in a range.
The COUNT function counts the number of cells that contain numbers
within the list of arguments, while the COUNTA function counts the
number of cells that are not empty and the values within the list of
arguments.
| Formula | Result | Descriptions |
|---|
| SUM(num1,num2,...) | SUM(A1:A10) | Add the cells within a range. | | SUMIF(range, criteria,sum_range) | SUMIF(A1:A10,”>100”,B1:B10) | Add
the cells within a range that meets specific criteria. The sum_range
are the cells to add that corresponds to cells in the range that match
the criteria. Blanks and text values are ignored. Criteria is 10, “10”,
“<10”, or B3. | | COUNT(value1,value2,...) | COUNT(A1:A10) | Counts the number of cells that contain numbers within the list of arguments. | | COUNTA(value1,value2,...) | COUNTA(A1:A10) | Counts the number of cells that are not empty and the values within the list of arguments. | | SUMIFS(sum_range,criteria_range1, criteria1, criteria_range2, criteria2...) | SUMIF(B1:B10,”>100”,A1:A10, “<1000,C1:C10) | Add
the cells within a range that meets multiple criteria. The sum_range
are the cells to add that corresponds to cells in the range that match
the criteria. Blanks and text values are ignored. Criteria is 10, “10”,
“<10”, or B3. | | COUNTIF (range, criteria) | COUNTIF(A1:A10,“CA”) | Counts
the number of cells within a range that meets specific criteria. Blanks
and text values are ignored. Criteria is 10, “10”, “<10”, or B3. | | COUNTIFS(range1, criteria1, range2, criteria2...) | COUNTIFS(A1:A10,“CA”, B1:B10,“94588”) | Counts
the number of cells within a range that meets multiple criteria. Blanks
and text values are ignored. Criteria is 10, “10”, “<10”, or B3. | | AVERAGE(range) | AVERAGE(A1:A10) | Adds a group of numbers and then divides by the count of those numbers. | | AVERAGEIF(range, criteria, average_range) | AVERAGE(A1:A10,”<1000” B1:B10) | Returns
the average of all the cell in a range that meets specific criteria.
TRUE or FALSE are ignored. Criteria is 10, “10”, “<10”, or B3. | | AVERAGEIFS(average_range, range1, criteria1,range2, criteria2...) | AVERAGE(B1:B10,”<1000” A1:A10,”>500”) | Returns
the average of all the cell in a range that meets multiple criteria.
TRUE or FALSE are ignored. Criteria is 10, “10”, “<10”, or B3. | | MIN(num1,num2,...) | MIN(A1:A10) | Returns the smallest number in a set of values. | | MAX(num1,num2,...) | MAX(A1:A10) | Returns the largest number in a set of values. |
|
