The layout of a chart typically comes with a chart
title, axis titles, and a legend. However, you can also include other
elements, such as data labels, and a data table. You can show, hide, or
change the positions of these elements to achieve the look you want. The
chart title typically appears at the top of the chart. However, you can
change the title position to appear as an overlap text object on top of
the chart. When you position the chart title as an overlay, the chart
is resized to the maximum allowable size. In the same way, you can also
reposition horizontal and vertical axis titles to achieve the best fit
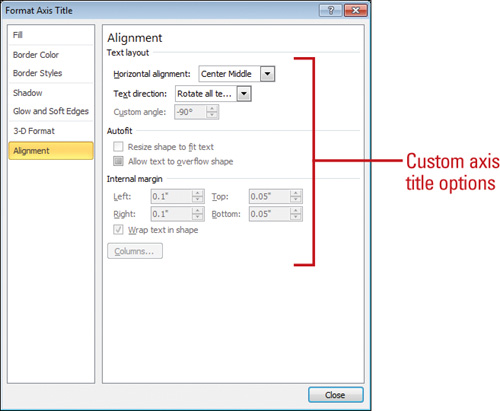
in a chart. If you want a more custom look, you can set individual
options using the Format dialog box.
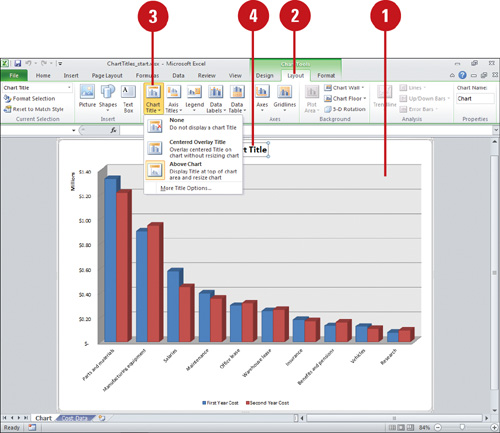
Change Chart Title
 Select the chart you want to modify. Select the chart you want to modify.
 Click the Layout tab under Chart Tools. Click the Layout tab under Chart Tools.
 Click the Chart Titles button, and then click one of the following: Click the Chart Titles button, and then click one of the following:
- None to hide the chart title.
- Centered Overlay Title to insert a title on the chart without resizing it.
- Above Chart to position the chart title at the top of the chart and resize it.
- More Title Options to set custom chart title options.
 Double-click the text box to place the insertion point, and then modify the text. Double-click the text box to place the insertion point, and then modify the text.
You can link a chart or axis title to a worksheet cell.
On the chart, click the chart or axis title you want to link, click in
the formula bar, type an equal sign (=), select the worksheet cell that
contains the data or text you want to display in the chart, and then
press Enter.
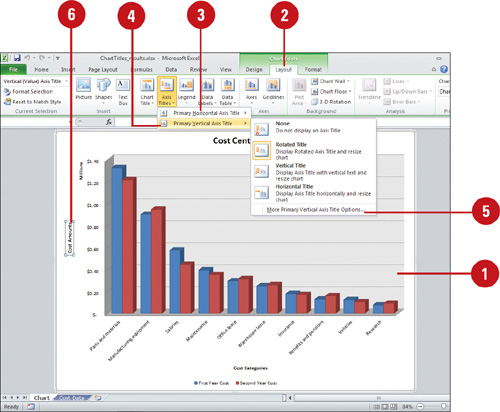
Change Chart Axis Titles
- Select the chart you want to modify.
- Click the Layout tab under Chart Tools.
- Click the Axis Titles button, point to Primary Horizontal Axis Title, and then click any of the following options:
- None to hide the axis title.
- Title Below Axis to display the title below the axis.
- Click the Axis Titles button, point to Primary Vertical Axis Title, and then click any of the following options (to show or hide):
- None to hide the axis title.
- Rotated Title to display the axis title rotated.
- Vertical Title to display the axis title vertical.
- Horizontal Title to display the axis title horizontal.
 To select custom chart axis titles options, click the Axis Titles button, and then do one of the following: To select custom chart axis titles options, click the Axis Titles button, and then do one of the following:
- Point to Primary Horizontal Axis Title, and then click More Primary Horizontal Axis Title Options.
- Point to Primary Vertical Axis Title, and then click More Primary Vertical Axis Title Options.
 To change title text, double-click the text box to place the insertion point, and then modify the text. To change title text, double-click the text box to place the insertion point, and then modify the text.
|
