Formatting Chart Text
Objects
such as chart and axis titles, data labels, and annotated text are
referred to as chart text. To make chart text more readable, you can use
formatting tools on the Home or Format tabs to change the text font,
style, and size. For example, you might decide to change your chart
title size and alignment, or change your axis text color. If you want to
change the way text appears, you can also rotate text to a diagonal
angle or vertical orientation. On the Format tab under Chart Tools, you
can apply WordArt and Shape Styles to chart text.
Format Chart Text
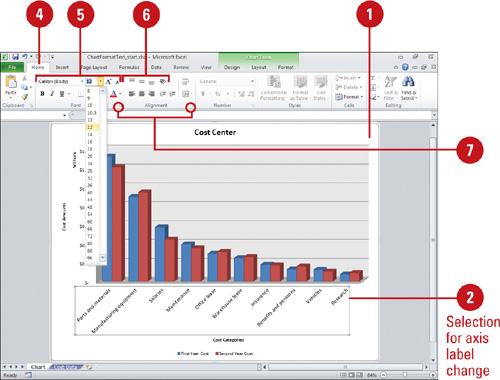
 Select the chart that contains the text you want to change.
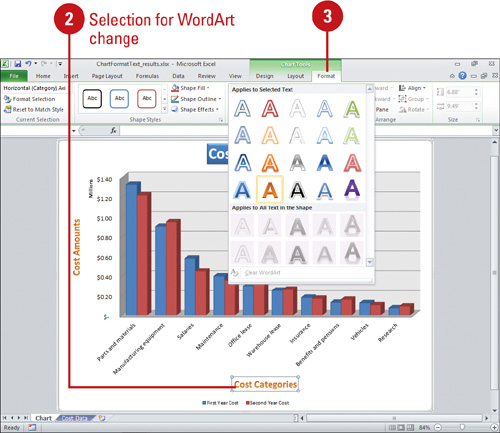
 Select the text object in the chart you want to format.
If you want to select only a portion of the text, click the text object
again to place the insertion point, and then select the part of the text
you want to format.
 Click the Format tab under Chart Tools, and then click the WordArt or Shape Style you want.
 Click the Home tab.
 In the Font group, select any combination of options: Font, Font Size,
Increase Font Size, Decrease Font Size, Bold, Italic, Underline, Fill
Color, or Font Color.
 In the Alignment group, select any combination of alignment options.
Timesaver
To quickly format chart text, right-click the text, and then click a formatting button on the Mini-Toolbar.
 To set custom text formatting options, click the Font or Alignment Dialog Box Launcher.


Formatting Line and Bar Charts
If
you’re using a line or bar chart, you can add trendlines, series lines,
drop lines, high-low lines, up/down bars, or error bars with different
options to make the chart easier to read. Trendlines
are graphical representations of trends in data that you can use to
analyze problems of prediction. For example, you can add a trendline to
forecast a trend toward rising revenue. Series lines connect data series in 2-D stacked bar and column charts. Drop lines extend a data point to a category in a line or area chart, which makes it easy to see where data markers begin and end. High-low lines
display the highest to the lowest value in each category in 2-D charts.
Stock charts are examples of high-low lines and up/down bars. Error bars
show potential error amounts graphically relative to each data marker
in a data series. Error bars are usually used in statistical or
scientific data.
Format Line and Bar Charts
 Select the line or bar chart you want to modify.
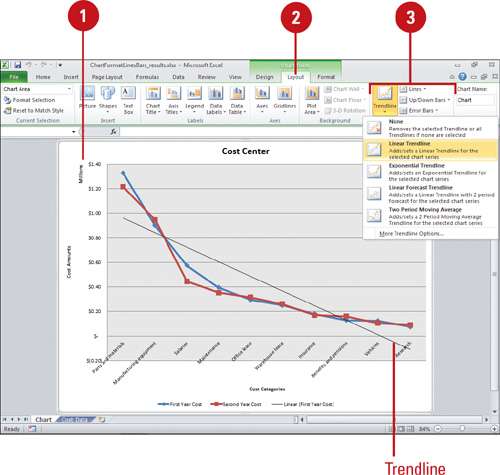
 Click the Layout tab under Chart Tools.
 In the Analysis group, click any of the following:
- Trendline to remove or add different types of trendlines: Linear, Exponential, Linear Forecast, and Two Period Moving Average.
- Lines
to hide Drop Lines, High-Low Lines or Series Lines, or show series
lines on a 2-D stacked Bar/Column Pie or Pie or Bar of Pie chart.
- Up/Down Bars to hide Up/Down Bars, or show Up/Down Bars on a line chart.
- Error Bars to hide error bars or show error bars with using Standard Error, Percentage, or Standard Deviation.
