1. Adding Labels to Flowcharts
In
the preceding exercise, you learned the mechanics of creating a
flowchart, but your diagram isn’t very useful yet because your shapes
have no labels, data, or identifying information.
In this exercise, you will add text labels to your flowchart shapes.
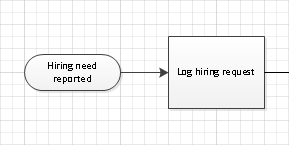
Double-click the start shape in the upper-left of your diagram, and then type Hiring need reported.
Double-click the first process shape in your flowchart, and then type Log hiring request.

Tip:
You can also add text to most
Visio shapes by clicking once to select the shape and then starting to
type. That technique will work with the flowchart shapes.
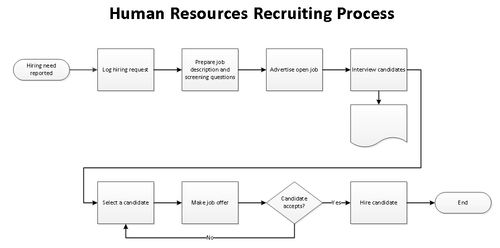
Continue from left to right across the top row and add the following labels to the process shapes:
Double-click and type the following text into the five shapes in the bottom row, moving from left to right:
Select a candidate
Make job offer
Candidate accepts?
Hire candidate
End
Double-click the connector between the Candidate accepts? shape and the Hire candidate shape and type Yes.
Double-click the connector between the Candidate accepts? shape and the Select a candidate shape and type No.
Add a text box to the top of the page and type Human Resources Recruiting Process as a title for the flowchart.
Select the title text box, and then set the font size to 24 pt. and make the text bold.
Your finished flowchart should look something like the following graphic.

Note:
Save your changes to the HR Recruiting Flowchart drawing, and then close it.
2. Understanding Swimlane Diagrams
Swimlane diagrams are
a popular variation on flowcharts because they correct one significant
failing of flowcharts: very few flowcharts show who is responsible for
each of the steps or who makes the key decisions.
A swimlane diagram, on the
other hand, is specifically organized by role, function, or department.
Each process step is placed into a specific lane based on who does the
work or who has the responsibility for that process step. For example, a
swimlane diagram with a focus on roles might include lanes marked Accounts Payable Clerk, Accounting Supervisor, and Chief Financial Officer. Similarly, a department-focused swimlane drawing might show lanes labeled Sales, Marketing, Order Processing, and Manufacturing.
Swimlane diagrams are also known as cross-functional flowcharts
because they show work steps as they cross the functional boundaries in
an organization. In this context, individual swimlanes are usually
referred to as functional bands.
Regardless of the terminology,
swimlane diagrams can be laid out with horizontal or vertical lanes.
Using Visio, you can choose the orientation you prefer, as you’ll see in
the exercise in the following section.
Tip:
Some Visio templates employ
additional software, outside of Visio itself, to perform their
functions. The cross-functional flowchart diagram is an example of this
type of Visio add-in. And, as is typical for this type of add-in,
cross-functional flowcharts present a custom tab on the ribbon. The
ribbon shown in the following graphic includes the Cross-Functional
Flowchart tab.
