You can change the chart display by showing axis or gridlines with different measurements. An axis
is a line bordering the chart plot area used as a reference for
measurement. Chart axes are typically x (vertical or value), y
(horizontal or category), and z (only for 3-D charts). If axis titles or
scales are too long and unreadable, you might want to change the angle
to make titles fit better in a small space, or change the interval
between tick marks and axis labels to display with a better scale. Tick marks are small lines of measurement similar to divisions on a ruler on an axis. Gridlines
are horizontal and vertical lines you can add to help the reader
determine data point values in a chart. There are two types of
gridlines: major and minor. Major gridlines occur at each value on an
axis, while minor gridlines occur between values on an axis. Use
gridlines sparingly and only when they improve the readability of a
chart.
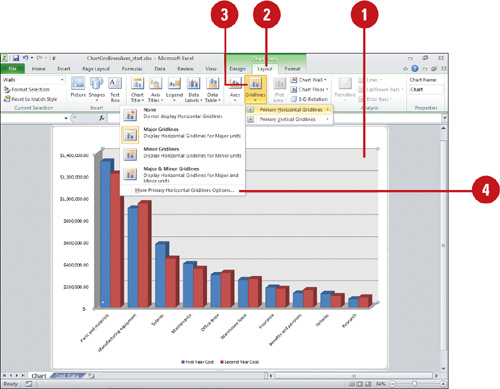
Change Chart Gridlines
 Select the chart element you want to modify. Select the chart element you want to modify.
 Click the Layout tab under Chart Tools. Click the Layout tab under Chart Tools.
 Click the Gridlines button, point to Primary Horizontal Gridlines, Primary Vertical Gridlines, or Depth Gridlines (3-D charts) and then click any of the following options: Click the Gridlines button, point to Primary Horizontal Gridlines, Primary Vertical Gridlines, or Depth Gridlines (3-D charts) and then click any of the following options:
- None
- Major Gridlines
- Minor Gridlines
- Major & Minor Gridlines
 To select custom chart gridlines options, click the Gridlines button, and then do one of the following: To select custom chart gridlines options, click the Gridlines button, and then do one of the following:
- Point to Primary Horizontal Gridlines, and then click More Primary Horizontal Gridlines Options.
- Point to Primary Vertical Gridlines, and then click More Primary Vertical Gridlines Options.
- Point to Depth Gridlines, and then click More Depth Gridlines Options.
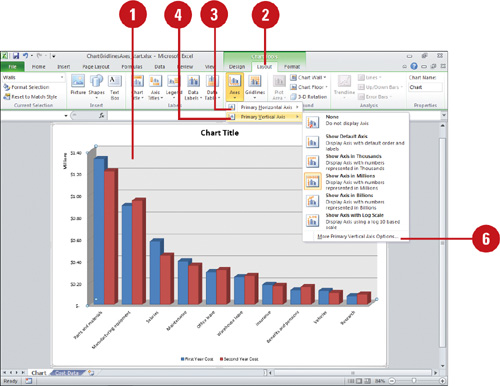
Change Chart Axes
- Select the chart element you want to modify.
- Click the Layout tab under Chart Tools.
- Click the Axes button, point to Primary Horizontal Axis, and then click any of the following options:
- None
- Show Left to Right Axis
- Show Axis without labeling
- Show Right to Left Axis
- Click the Axes button, point to Primary Vertical Axis, and then click any of the following options:
- None
- Show Default Axis
- Show Axis in Thousands
- Show Axis in Millions
- Show Axis in Billions
- Show Axis with Log Scale
 Click the Axes button, point to Depth Axis (3-D charts), and then click any of the following options: Click the Axes button, point to Depth Axis (3-D charts), and then click any of the following options:
- None
- Show Default Axis
- Show Axis without labeling
- Show Reverse Axis
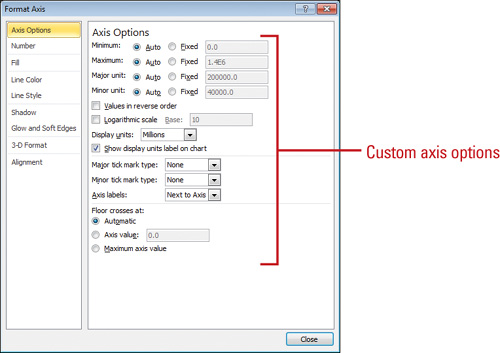
 To select custom chart axes options, click the Axes button, and then do one of the following: To select custom chart axes options, click the Axes button, and then do one of the following:
- Point to Primary Horizontal Axis, and then click More Primary Horizontal Axis Options.
- Point to Primary Vertical Axis, and then click More Primary Vertical Axis Options.
- Point to Depth Axis, and then click More Depth Axis Options.
|
