Changing a Chart Type
Your
chart is what your audience sees, so make sure to take advantage of
Excel’s pre-built chart layouts and styles to make the chart appealing
and visually informative. Start by choosing the chart type that is best
suited for presenting your data. There are a wide variety chart types,
available in 2-D and 3-D formats, from which to choose. For each chart
type, you can select a predefined chart layout and style to apply the
formatting you want. If you want to format your chart beyond the
provided formats, you can customize a chart. Save your customized
settings so that you can apply that chart formatting to any chart you
create. You can change the chart type for the entire chart, or you can
change the chart type for a selected data series to create a combination
chart.
Change a Chart Type for an Entire Chart
 Select the chart you want to change.
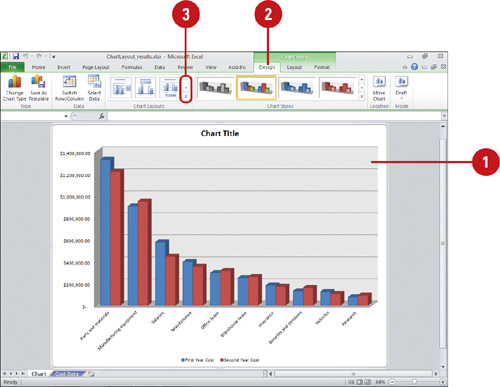
 Click the Design tab under Chart Tools.
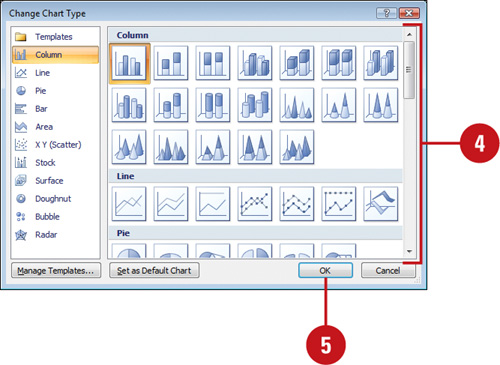
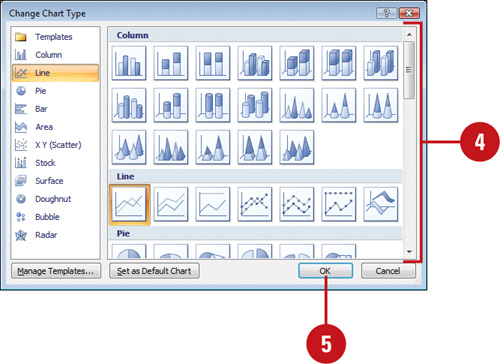
 Click the Change Chart Type button.
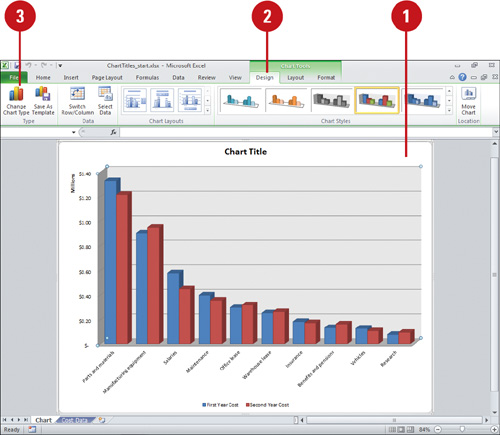
 Click the chart type you want.
 Click OK.
You can reset chart formatting. Click the chart you want to reset, click the Format tab under Chart Tools, and then click the Reset To Match Style button.
You can delete a chart. Click the chart object, and then press Delete.
Change a Chart Type of a Single Data Series
- Select the data series in a chart you want to change.
You can only change the chart type of one data series at a time.
- Click the Design tab under Chart Tools.
- Click the Change Chart Type button.
- Click the chart type you want.
- Click OK.
Changing a Chart Layout and Style
Excel’s
pre-built chart layouts and styles can make your chart more appealing
and visually informative. Start by choosing the chart type that is best
suited for presenting your data. There are a wide variety chart types,
available in 2-D and 3-D formats, from which to choose. For each chart
type, you can select a predefined chart layout and style to apply the
formatting you want. If you want to format your chart beyond the
provided formats, you can customize a chart. Save your customized
settings so that you can apply that chart formatting to any chart you
create.
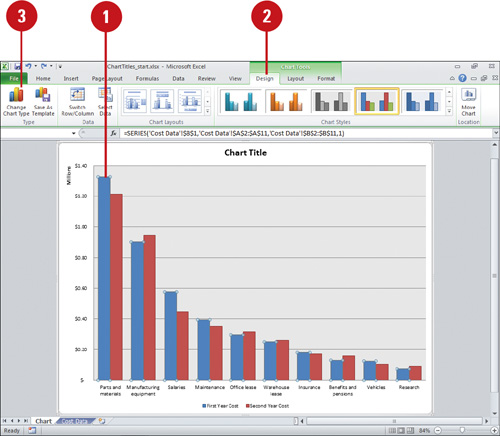
Change a Chart Layout or Style
- Select the chart you want to change.
- Click the Design tab under Chart Tools.
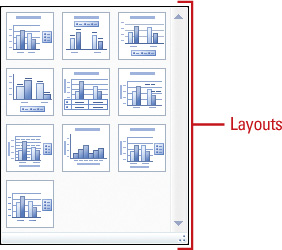
- To change the chart layout, click the scroll up or down arrow, or click the More list arrow in the Chart Layouts group to see variations of the chart type.
- Click the chart layout you want.
You can record macros with chart elements. When you use the macro recorder with charts, it now records formatting changes to charts and other objects (New!).
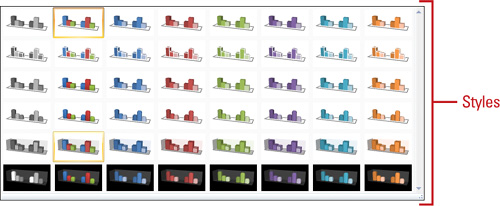
Apply a Chart Style
- Select the chart you want to change.
- Click the Design tab under Chart Tools.
- Click the scroll up or down arrow, or click the More list arrow in the Chart Styles group to see color variations of the chart layout.
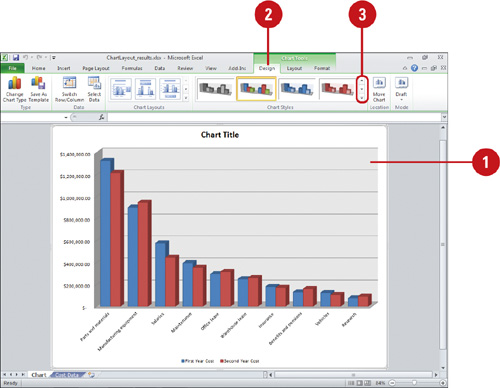
- Click the chart style you want.