Editing a Chart
Editing
a chart means altering any of its features, from data selection to
formatting elements. For example, you might want to use more effective
colors or patterns in a data series. To change a chart’s type or any
element within it, you must select the chart or element. When a chart is
selected, handles are displayed around the window’s perimeter, and
chart tools become available on the Design, Layout, and Format tabs. As
the figure below illustrates, you can point to any object or area on a
chart to see what it is called. When you select an object, its name
appears in the Chart Objects list box on the Ribbon, and you can then
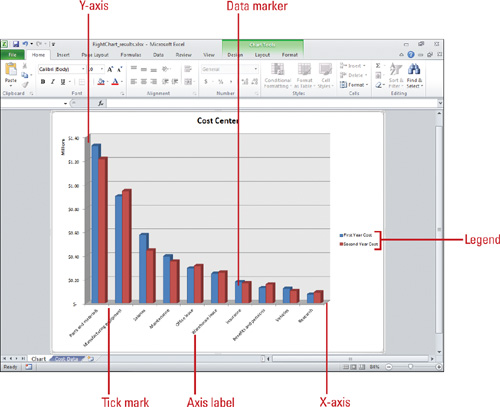
edit it. A chart consists of the following elements.
Data markers.
A graphical representation of a data point in a single cell in the
datasheet. Typical data markers include bars, dots, or pie slices.
Related data markers constitute a data series.
Legend. A pattern or color that identifies each data series.
X-axis. A reference line for the horizontal data values.
Y-axis. A reference line for the vertical data values.
Tick marks. Marks that identify data increments.
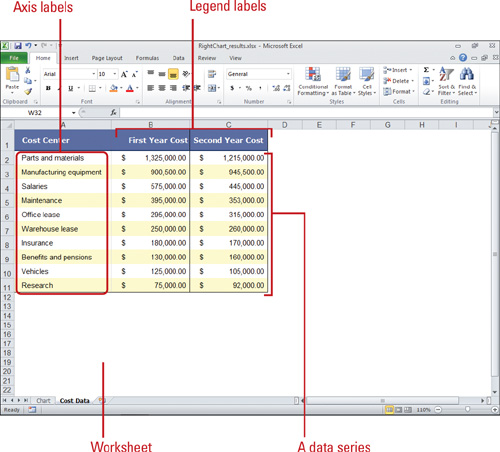
Editing a chart has no effect
on the data used to create it. You don’t need to worry about updating a
chart if you change worksheet data because Excel automatically does it
for you. The only chart element you might need to edit is a data range.
If you decide you want to plot more or less data in a range, you can
select the data series on the worksheet, as shown in the figure below,
and then drag the outline to include the range you want in the chart.
Moving and Resizing a Chart
You
can move or resize an embedded chart after you select it. If you’ve
created a chart as a new sheet instead of an embedded object on an
existing worksheet, the chart’s size and location are fixed by the
sheet’s margins. You can change the margins to resize or reposition the
chart. If you don’t like the location, you can move the embedded chart
off the original worksheet and onto another worksheet. When resizing a
chart downward, be sure to watch out for legends and axis titles.
Move an Embedded Chart
 Select a chart you want to move.
 Position the mouse pointer over a blank area of the chart, and then
drag the pointer to move the outline of the chart to a new location.
Position the mouse pointer over a blank area of the chart, and then
drag the pointer to move the outline of the chart to a new location.
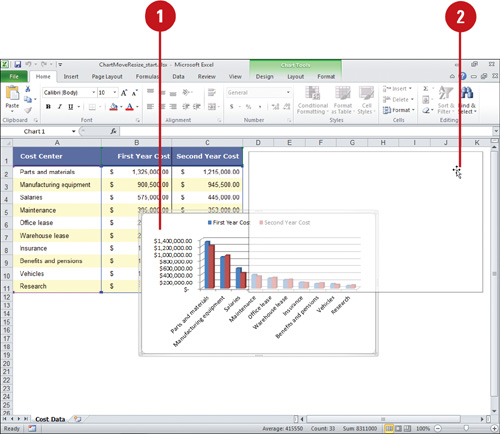
 Release the mouse button.
Resize an Embedded Chart
- Select a chart you want to resize.
- Position the mouse pointer over one of the handles.
- Drag the handle to the new chart size.
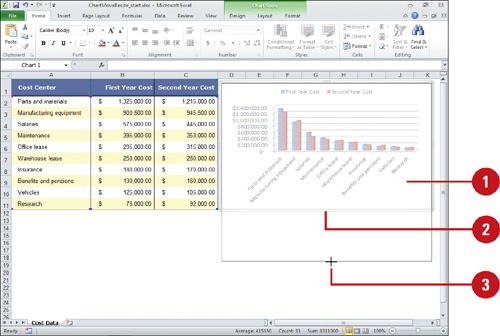
 Release the mouse button.
