Selecting Chart Elements
Chart elements are the individual objects that make up a chart, such as an axis, the legend, or a data series. The plot area is the bordered area where the data are plotted. The chart area
is the area between the plot area and the chart elements selection box.
Before you can change or format a chart element, you need to select it
first. You can select a chart element directly on the chart or use the
Chart Elements list arrow on the Ribbon. When you select a chart,
handles (small white circles) display around the window’s perimeter, and
chart tools become available on the Design, Layout, and Format tabs.
When you select an element in a chart, the name of the object appears in
the Chart Elements list, which indicates that you can now edit it.
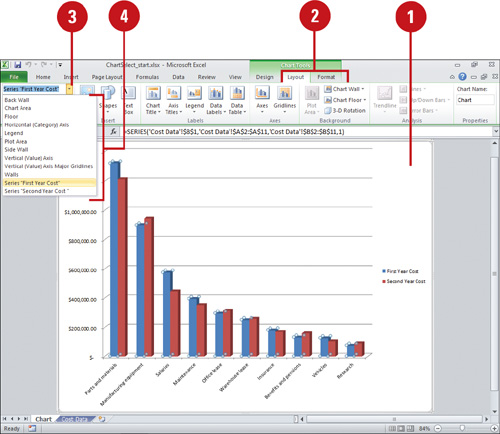
Select a Chart Element
 Select the chart you want to change. Select the chart you want to change.
 Click the Format or Layout tab under Chart Tools. Click the Format or Layout tab under Chart Tools.
 Click the Chart Elements list arrow. Click the Chart Elements list arrow.
 Click the chart element you want to select. Click the chart element you want to select.
When a chart object is selected, selection handles appear.
Timesaver
To select a chart object, click a chart element directly in the chart.
You can enlarge a chart object to select it. Increase the zoom percentage to enlarge your view before using the mouse pointer to select chart objects. Formatting Chart Elements
Before
you can format a chart element, you need to select it first. You can
select a chart element directly on the chart or use the Chart Elements
list arrow on the Ribbon. After you select a chart element, you can use
the Format Selection button to open the Format dialog box, where you can
change formatting options, including number, fill, border color and
styles, shadow, 3-D format, and alignment. Formatting options vary
depending on the selected chart element. In the same way you can apply
shape fills, outlines, and effects to a shape, you can also apply them
to elements and shapes in a chart.
Format a Chart Object
- Select the chart element you want to modify.
- Click the Format tab under Chart Tools.
- Click the Format Selection button.
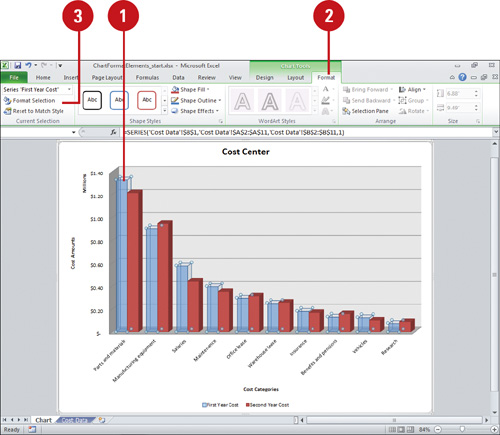 - Select the options you want. The available options vary depending on the chart.
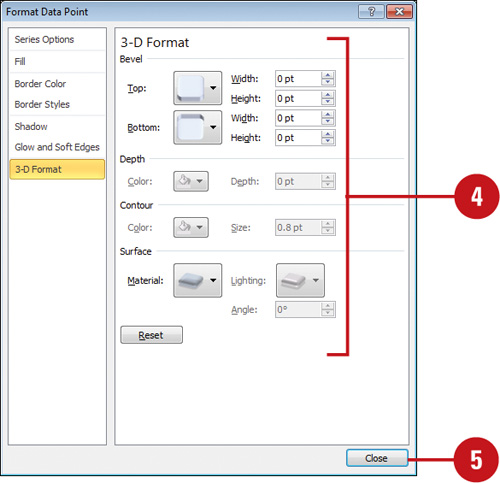
Some common formatting option categories in the left pane include the following:
- Number to change number formats.
- Fill to remove or change the fill color, either solid, gradient, picture, or texture.
- Border Color or Styles to remove or change the border color and styles, either solid or gradient line.
- Shadow to change shadow options, including color, transparency, size, blur, angle, and distance.
- 3-D Format to change 3-D format options, including bevel, depth, contour, and surface.
- Alignment to change text alignment, direction, and angle.
 Click Close. Click Close.
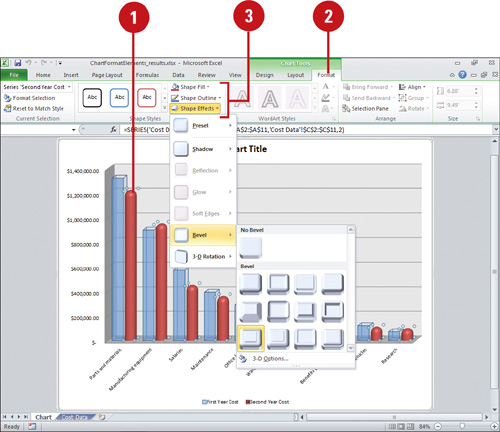
Apply a Shape Style to a Chart Object
- Select the chart element you want to modify.
- Click the Format tab under Chart Tools.
- Click the Shape Fill, Shape Outline, or Shape Effects button, and then click or point to an option.
- Fill. Click a color, No Fill, or Picture to select an image, or point to Gradient, or Texture, and then select a style.
- Outline. Click a color or No Outline, or point to Weight, or Dashes, and then select a style.
- Effects. Point to an effect category (Preset, Shadow, Reflection, Glow, Soft Edges, Bevel, or 3-D Rotations), and then select an option.
You can quickly access chart formatting options. Double-click a chart element to open a formatting dialog box (New!).
|
