10. Performance Monitor
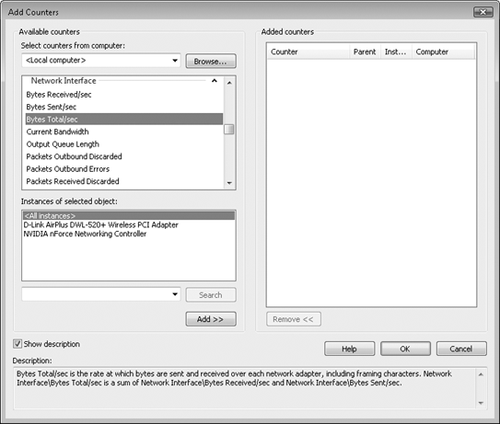
You can use Performance Monitor, shown in Figure 2, to view thousands of real-time counters containing information about your computer or a remote computer. When troubleshooting
network performance problems, you can use Performance Monitor to view
current bandwidth utilization in a more detailed way than provided by
Task Manager or Resource Monitor. Additionally, Performance Monitor
provides access to counters measuring retries, errors, and much more.
Performance Monitor provides
access to the following categories, which contain counters that might be
useful for troubleshooting network problems:
.NET CLR Networking
Examines network statistics for specific Microsoft .NET Framework
applications. Use these counters if you are experiencing
application-specific networking problems and the application is based on
the .NET Framework. BITS Net Utilization
Provides statistics related to Background Intelligent Transfer Service
(BITS), which is used to transfer files in the background. Windows
Update, among other applications, uses BITS to transfer files. Use these
counters if you think a network performance problem might be related to
BITS transfers or if BITS transfers do not perform as expected. Browser
Provides statistics related to the Computer Browser service, which is
used to browse network resources. Use these counters only if you are
troubleshooting problems with browsing local networks, specifically for
resources such as Windows XP or earlier versions of Windows. ICMP and ICMPv6
Provide ICMP statistics. ICMP is used by tools such as Ping, Tracert,
and PathPing. Use these counters only if you are actively using ICMP to
test network connectivity. IPsec AuthIPv4, IPsec AuthIPv6, IPsec Driver, IPsec IKEv4, and IPsec IKEv6
Provide Internet Protocol security (IPsec) statistics. Use these
counters if you are experiencing networking problems and IPsec is
enabled in your environment. IPv4 and IPv6
These categories provide Layer 3 networking information, such as
fragmentation statistics. If you need to monitor total network
utilization, you should use the Network Interface counters instead. NBT Connection Provides information about bytes sent and received for NetBIOS networking, such as file and printer sharing. Network Interface The most useful category for troubleshooting,
this provides counters for all network traffic sent to and from a
single network adapter. These counters are the most reliable way to
measure total network utilization. Network Interface counters also
provide information about errors. Redirector
Provides statistics gathered from the Windows redirector, which helps
direct traffic to and from different networking features. Interpreting
most of these counters requires a detailed understanding of the Windows
network stack. However, the Network Errors/sec counter can be useful for
diagnosing network problems. Server
Provides statistics related to sharing files and printers, including
bandwidth used and the number of errors. Use these counters when
troubleshooting file and printer sharing from the server. TCPv4 and TCPv6
Provide information about TCP connections. Of particular interest for
troubleshooting are the Connection Failures, Connections Active, and
Connections Established counters. UDPv4 and UDPv6
Provide information about UDP communications. Use these counters to
determine whether a computer is sending or receiving UDP data, such as
DNS requests. Monitor the Datagrams No Port/sec and Datagrams Received
Errors counters to determine whether a computer is receiving unwanted
UDP traffic.
To access Performance Monitor, follow these steps:
Click Start, right-click Computer, and then click Manage. Expand System Tools, expand Performance, and then expand Monitoring Tools. Click Performance Monitor. Add counters to the real-time graph by clicking the green plus sign on the toolbar.
11. Data Collector Sets
While you can use
Performance Monitor to gather a custom set of information, it's
generally quicker to start one of the built-in data collector sets. Both
the System Diagnostics and System Performance data collector sets
gather network performance counters that might reveal the cause of
network problems.
To use a data collector set, follow these steps:
Click Start, right-click Computer, and then click Manage. Expand Performance, Data Collector Sets, and System. Under System, right-click System Diagnostics, and then click Start. Starting
diagnostics tracing causes Windows to collect detailed information
about network adapters and overall operating system performance. Now
that you have started tracing, you should reproduce the networking
problem. The data collector set will gather data for 60 seconds. Windows
takes a few seconds to generate a report after you stop tracing. Then,
you can view the collected information in a report, as shown in Figure 3. To view the report, under Performance, expand Reports. Then, expand System Diagnostics and click the latest report.
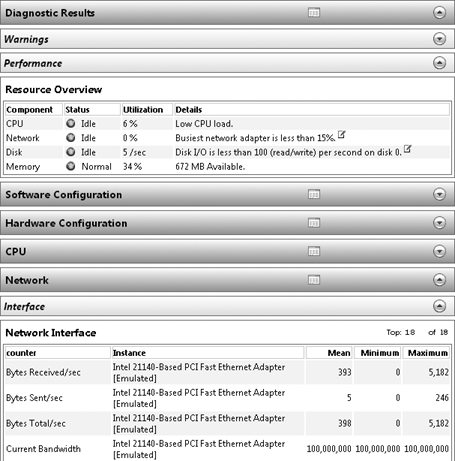
Depending on the type of report, it can include the following information:
Computer make and model Operating system version A list of all services, their current states, and their PIDs Network adapter driver information and networking system files and versions Processor, disk, network, and memory utilization Total bandwidth of each network adapter Packets sent and received Active TCPv4 and TCPv6 connections
|
